

Question: Tasks = 1. Use python to create 3 different plots of the following functions (4 points): fi(n) = (210)(n) + 210 f2(n) = n(3.5) 1000
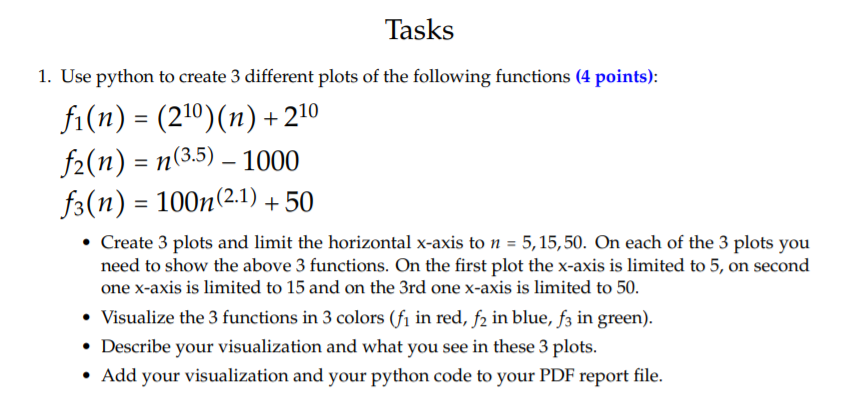
Tasks = 1. Use python to create 3 different plots of the following functions (4 points): fi(n) = (210)(n) + 210 f2(n) = n(3.5) 1000 f3(n) = 100n(2.1) +50 Create 3 plots and limit the horizontal x-axis to n = 5, 15,50. On each of the 3 plots you need to show the above 3 functions. On the first plot the x-axis is limited to 5, on second one x-axis is limited to 15 and on the 3rd one x-axis is limited to 50. Visualize the 3 functions in 3 colors (fi in red, f2 in blue, f3 in green). Describe your visualization and what you see in these 3 plots. Add your visualization and your python code to your PDF report file
Step by Step Solution
There are 3 Steps involved in it
1 Expert Approved Answer
Step: 1 Unlock

Question Has Been Solved by an Expert!
Get step-by-step solutions from verified subject matter experts
Step: 2 Unlock
Step: 3 Unlock