

Question: TB MC Qu. 7-118 (Static) The graph below shows the population... The graph below shows the population distribution of variable X with expected value .
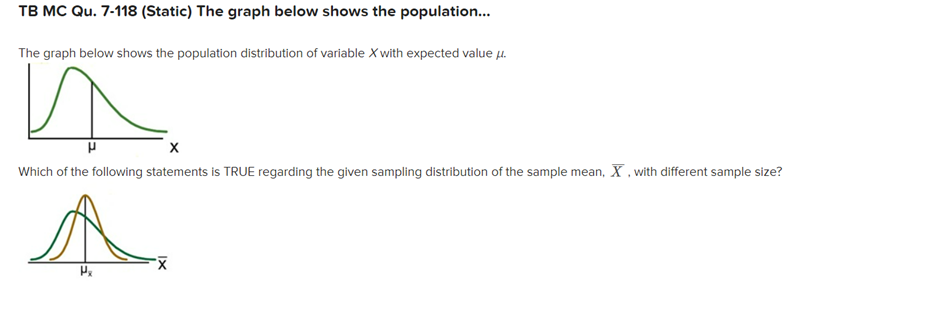

TB MC Qu. 7-118 (Static) The graph below shows the population... The graph below shows the population distribution of variable X with expected value . X Which of the following statements is TRUE regarding the given sampling distribution of the sample mean, X , with different sample size? X
Step by Step Solution
There are 3 Steps involved in it
1 Expert Approved Answer
Step: 1 Unlock

Question Has Been Solved by an Expert!
Get step-by-step solutions from verified subject matter experts
Step: 2 Unlock
Step: 3 Unlock