

Team Arizona Diamondbacks League Team Salary ($ mil) Year Stadium Attendance HR BA Wins ERA Opened...
Fantastic news! We've Found the answer you've been seeking!
Question:
Transcribed Image Text:
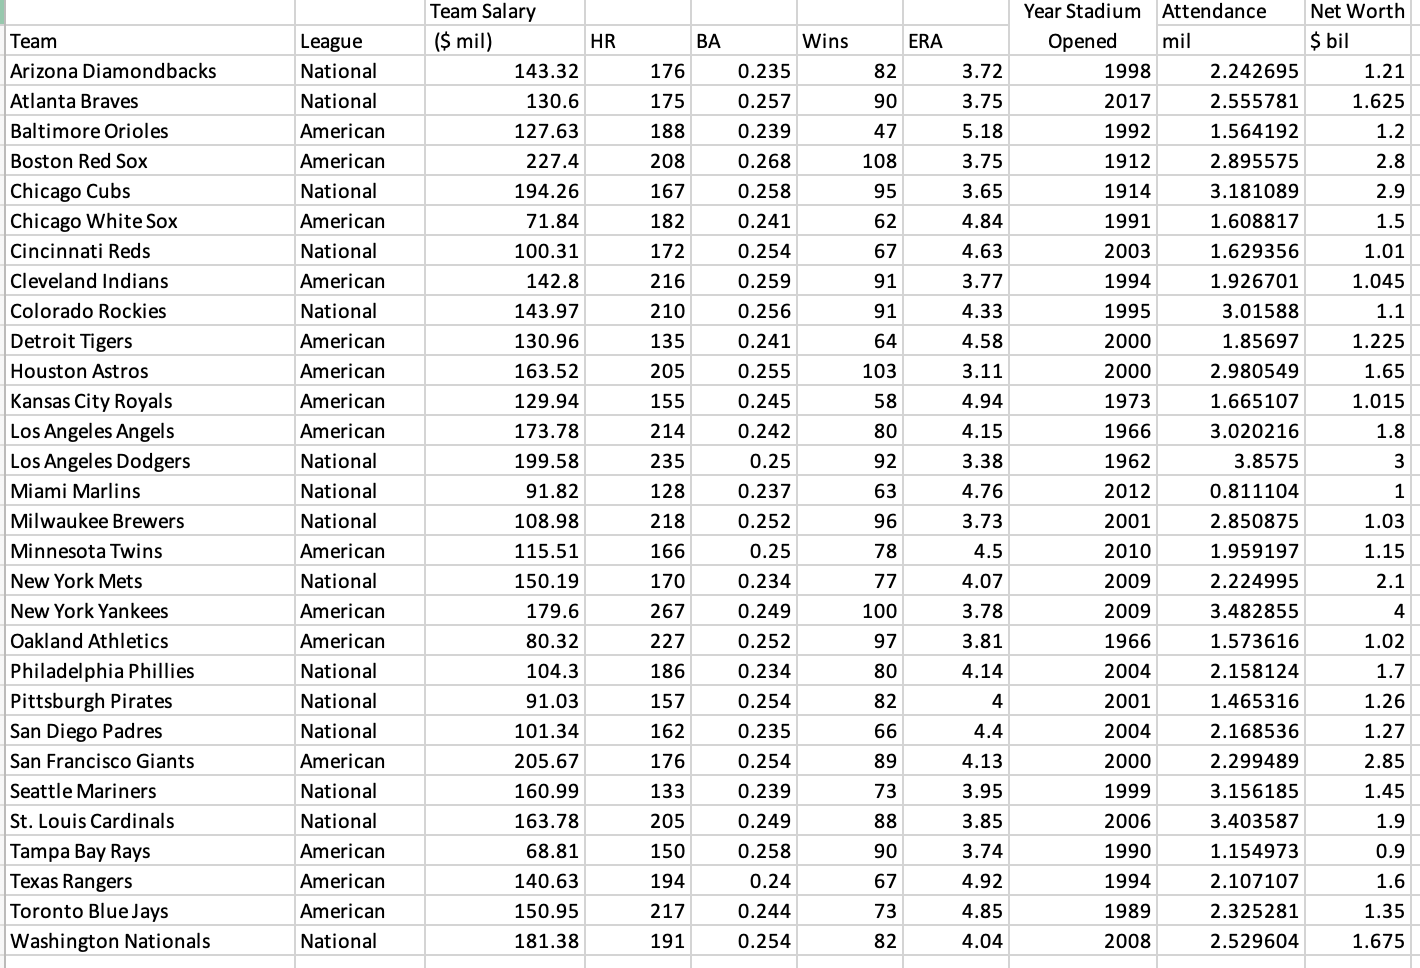
Team Arizona Diamondbacks League Team Salary ($ mil) Year Stadium Attendance HR BA Wins ERA Opened mil Net Worth $ bil National 143.32 176 0.235 82 3.72 1998 2.242695 1.21 Atlanta Braves National 130.6 175 0.257 90 3.75 2017 2.555781 1.625 Baltimore Orioles American 127.63 188 0.239 47 5.18 1992 1.564192 1.2 Boston Red Sox American 227.4 208 0.268 108 3.75 1912 2.895575 2.8 Chicago Cubs National 194.26 167 0.258 95 3.65 1914 3.181089 2.9 Chicago White Sox American 71.84 182 0.241 62 4.84 1991 1.608817 1.5 Cincinnati Reds National 100.31 172 0.254 67 4.63 2003 1.629356 1.01 Cleveland Indians American 142.8 216 0.259 91 3.77 1994 1.926701 1.045 Colorado Rockies National 143.97 210 0.256 91 4.33 1995 3.01588 1.1 Detroit Tigers American 130.96 135 0.241 64 4.58 2000 1.85697 1.225 Houston Astros American 163.52 205 0.255 103 3.11 2000 2.980549 1.65 Kansas City Royals American 129.94 155 0.245 58 4.94 1973 1.665107 1.015 Los Angeles Angels American 173.78 214 0.242 80 4.15 1966 3.020216 1.8 Los Angeles Dodgers National 199.58 235 0.25 92 3.38 1962 3.8575 3 Miami Marlins National 91.82 128 0.237 63 4.76 2012 0.811104 1 Milwaukee Brewers National 108.98 218 0.252 96 3.73 2001 2.850875 1.03 Minnesota Twins American 115.51 166 0.25 78 4.5 2010 1.959197 1.15 New York Mets National 150.19 170 0.234 77 4.07 2009 2.224995 2.1 New York Yankees American 179.6 267 0.249 100 3.78 2009 3.482855 4 Oakland Athletics American 80.32 227 0.252 97 3.81 1966 1.573616 1.02 Philadelphia Phillies National 104.3 186 0.234 80 4.14 2004 2.158124 1.7 Pittsburgh Pirates National 91.03 157 0.254 82 4 2001 1.465316 1.26 San Diego Padres National 101.34 162 0.235 66 4.4 2004 2.168536 1.27 San Francisco Giants American 205.67 176 0.254 89 4.13 2000 2.299489 2.85 Seattle Mariners National 160.99 133 0.239 73 3.95 1999 3.156185 1.45 St. Louis Cardinals National 163.78 205 0.249 88 3.85 2006 3.403587 1.9 Tampa Bay Rays American 68.81 150 0.258 90 3.74 1990 1.154973 0.9 Texas Rangers American 140.63 194 0.24 67 4.92 1994 2.107107 1.6 Toronto Blue Jays American 150.95 217 0.244 73 4.85 1989 Washington Nationals National 181.38 191 0.254 82 4.04 2008 2.325281 2.529604 1.35 1.675 Team Arizona Diamondbacks League Team Salary ($ mil) Year Stadium Attendance HR BA Wins ERA Opened mil Net Worth $ bil National 143.32 176 0.235 82 3.72 1998 2.242695 1.21 Atlanta Braves National 130.6 175 0.257 90 3.75 2017 2.555781 1.625 Baltimore Orioles American 127.63 188 0.239 47 5.18 1992 1.564192 1.2 Boston Red Sox American 227.4 208 0.268 108 3.75 1912 2.895575 2.8 Chicago Cubs National 194.26 167 0.258 95 3.65 1914 3.181089 2.9 Chicago White Sox American 71.84 182 0.241 62 4.84 1991 1.608817 1.5 Cincinnati Reds National 100.31 172 0.254 67 4.63 2003 1.629356 1.01 Cleveland Indians American 142.8 216 0.259 91 3.77 1994 1.926701 1.045 Colorado Rockies National 143.97 210 0.256 91 4.33 1995 3.01588 1.1 Detroit Tigers American 130.96 135 0.241 64 4.58 2000 1.85697 1.225 Houston Astros American 163.52 205 0.255 103 3.11 2000 2.980549 1.65 Kansas City Royals American 129.94 155 0.245 58 4.94 1973 1.665107 1.015 Los Angeles Angels American 173.78 214 0.242 80 4.15 1966 3.020216 1.8 Los Angeles Dodgers National 199.58 235 0.25 92 3.38 1962 3.8575 3 Miami Marlins National 91.82 128 0.237 63 4.76 2012 0.811104 1 Milwaukee Brewers National 108.98 218 0.252 96 3.73 2001 2.850875 1.03 Minnesota Twins American 115.51 166 0.25 78 4.5 2010 1.959197 1.15 New York Mets National 150.19 170 0.234 77 4.07 2009 2.224995 2.1 New York Yankees American 179.6 267 0.249 100 3.78 2009 3.482855 4 Oakland Athletics American 80.32 227 0.252 97 3.81 1966 1.573616 1.02 Philadelphia Phillies National 104.3 186 0.234 80 4.14 2004 2.158124 1.7 Pittsburgh Pirates National 91.03 157 0.254 82 4 2001 1.465316 1.26 San Diego Padres National 101.34 162 0.235 66 4.4 2004 2.168536 1.27 San Francisco Giants American 205.67 176 0.254 89 4.13 2000 2.299489 2.85 Seattle Mariners National 160.99 133 0.239 73 3.95 1999 3.156185 1.45 St. Louis Cardinals National 163.78 205 0.249 88 3.85 2006 3.403587 1.9 Tampa Bay Rays American 68.81 150 0.258 90 3.74 1990 1.154973 0.9 Texas Rangers American 140.63 194 0.24 67 4.92 1994 2.107107 1.6 Toronto Blue Jays American 150.95 217 0.244 73 4.85 1989 Washington Nationals National 181.38 191 0.254 82 4.04 2008 2.325281 2.529604 1.35 1.675
Expert Answer:

Posted Date:
Students also viewed these mathematics questions
-
Find the nth, or general, term. a. 1, 3, 9,...... b. 25, 5, 1,....... c. 1, -1, 1, -1, .....
-
The financial statements of Apple Inc. are presented in Appendix A at the end of this textbook. Instructions for accessing and using the companys complete annual report, including the notes to the...
-
According to the National Cancer Institute, for women between 50 and 59, there is a 2.38% chance of being diagnosed with breast cancer. Screening mammography has a sensitivity of about 85% for women...
-
Under what circumstances is goodwill recorded?
-
Presented below are certain account balances of Paczki Products Co. Instructions From the foregoing, compute the following: (a) Total net revenue, (b) Net income, (c) Dividends declared, and (d)...
-
Requirement 1. Calculate net present value. (Use factors to three decimal places, X.XXX, and use a minus sign or parentheses for a negative net present value. Enter the net present value of the...
-
Yesterday the exchange rate between the Tomato and the U.S. dollar was USD 0.5000/Tomato. What will be the exchange rate tomorrow if you expect the tomato to appreciate by 20 %? Give your answer in...
-
Claire wants to buy a car when she graduates from North State University 5 years from now. She believes that she will need $29,500 to buy the car. Calculate how much money Claire must put into her...
-
Suppose we have the following returns for large-company stocks and Treasury bills over a six-year period: Year Large-Company US Treasury Bill 1 3.96 8.56 2 14.46 9.40 3 19.15 8.27 4 14.53 7.31 5...
-
Alpha Inc. generates $5 million in profits based on annual sales of $10,729,000. It has a degree of operating leverage of 2.50. What are the expected profits if sales increase to $14,584,000?
-
Kieran Knowles is the assistant accountant for the Vivo Ltd, a public company group. Kieran has recorded the following entries in the consolidation worksheet for the year ended 30 June 2023, using a...
-
Harris Fabrics computes its plantwide predetermined overhead rate annually on the basis of direct labor - hours. At the beginning of the year, it estimated that 70 , 0 0 0 direct labor - hours would...
-
Due to an unequal distribution of fuel in the wing tanks, the centers of gravity for the airplane fuselage A and wings B and C are located as shown. Draw a free-body diagram of the airplane. If these...
-
Find the market equilibrium point for the following demand and supply functions. Demand: 2p = - q + 56 Supply: 3p - q = 34

Study smarter with the SolutionInn App