

Question: TECHNICAL ANALYSIS must all show work thanks TECHNICAL ANALYSIS Question 1 Date 23/08/2017 26/08/2017 27/08/2017 28/08/2017 29/08/2017 30/08/2017 02/09/2017 03/09/2017 04/09/2017 05/09/2017 GSK 1673.0 1673.0
TECHNICAL ANALYSIS
must all show work thanks
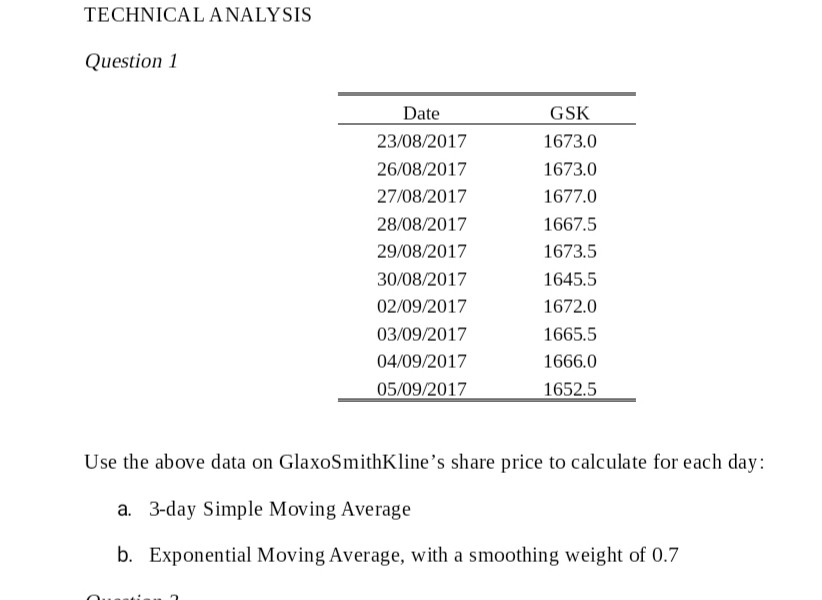
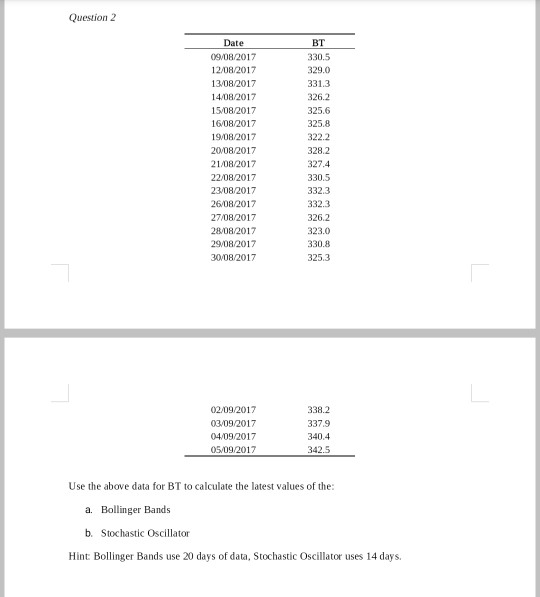
TECHNICAL ANALYSIS Question 1 Date 23/08/2017 26/08/2017 27/08/2017 28/08/2017 29/08/2017 30/08/2017 02/09/2017 03/09/2017 04/09/2017 05/09/2017 GSK 1673.0 1673.0 1677.0 1667.5 1673.5 1645.5 1672.0 1665.5 1666.0 1652.5 Use the above data on GlaxoSmithKline's share price to calculate for each day: a. 3-day Simple Moving Average b. Exponential Moving Average, with a smoothing weight of 0.7 Question 2 Date 09/08/2017 12/08/2017 13/08/2017 14/08/2017 15/08/2017 16/08/2017 19/08/2017 20/08/2017 21/08/2017 22/08/2017 23/08/2017 26/08/2017 27/08/2017 28/08/2017 29/08/2017 30/08/2017 BT 330.5 329.0 331.3 326.2 325.6 325.8 322.2 328.2 327.4 330,5 332.3 332.3 326.2 323.0 330.8 325.3 02/09/2017 03/09/2017 04/09/2017 05/09/2017 338.2 337.9 340.4 342.5 Use the above data for BT to calculate the latest values of the: a. Bollinger Bands b. Stochastic Oscillator Hint Bollinger Bands use 20 days of data, Stochastic Oscillator uses 14 days
Step by Step Solution
There are 3 Steps involved in it

Get step-by-step solutions from verified subject matter experts