

Question: Technical analysis, or charting, searches for patterns in the price or volume history of a stock to predict future price movements. Below are three charts
 Technical analysis, or charting, searches for patterns in the price or volume history of a stock to predict future price movements. Below are three charts showing the price pattern of shares of Limuru Tea Co. Ltd.
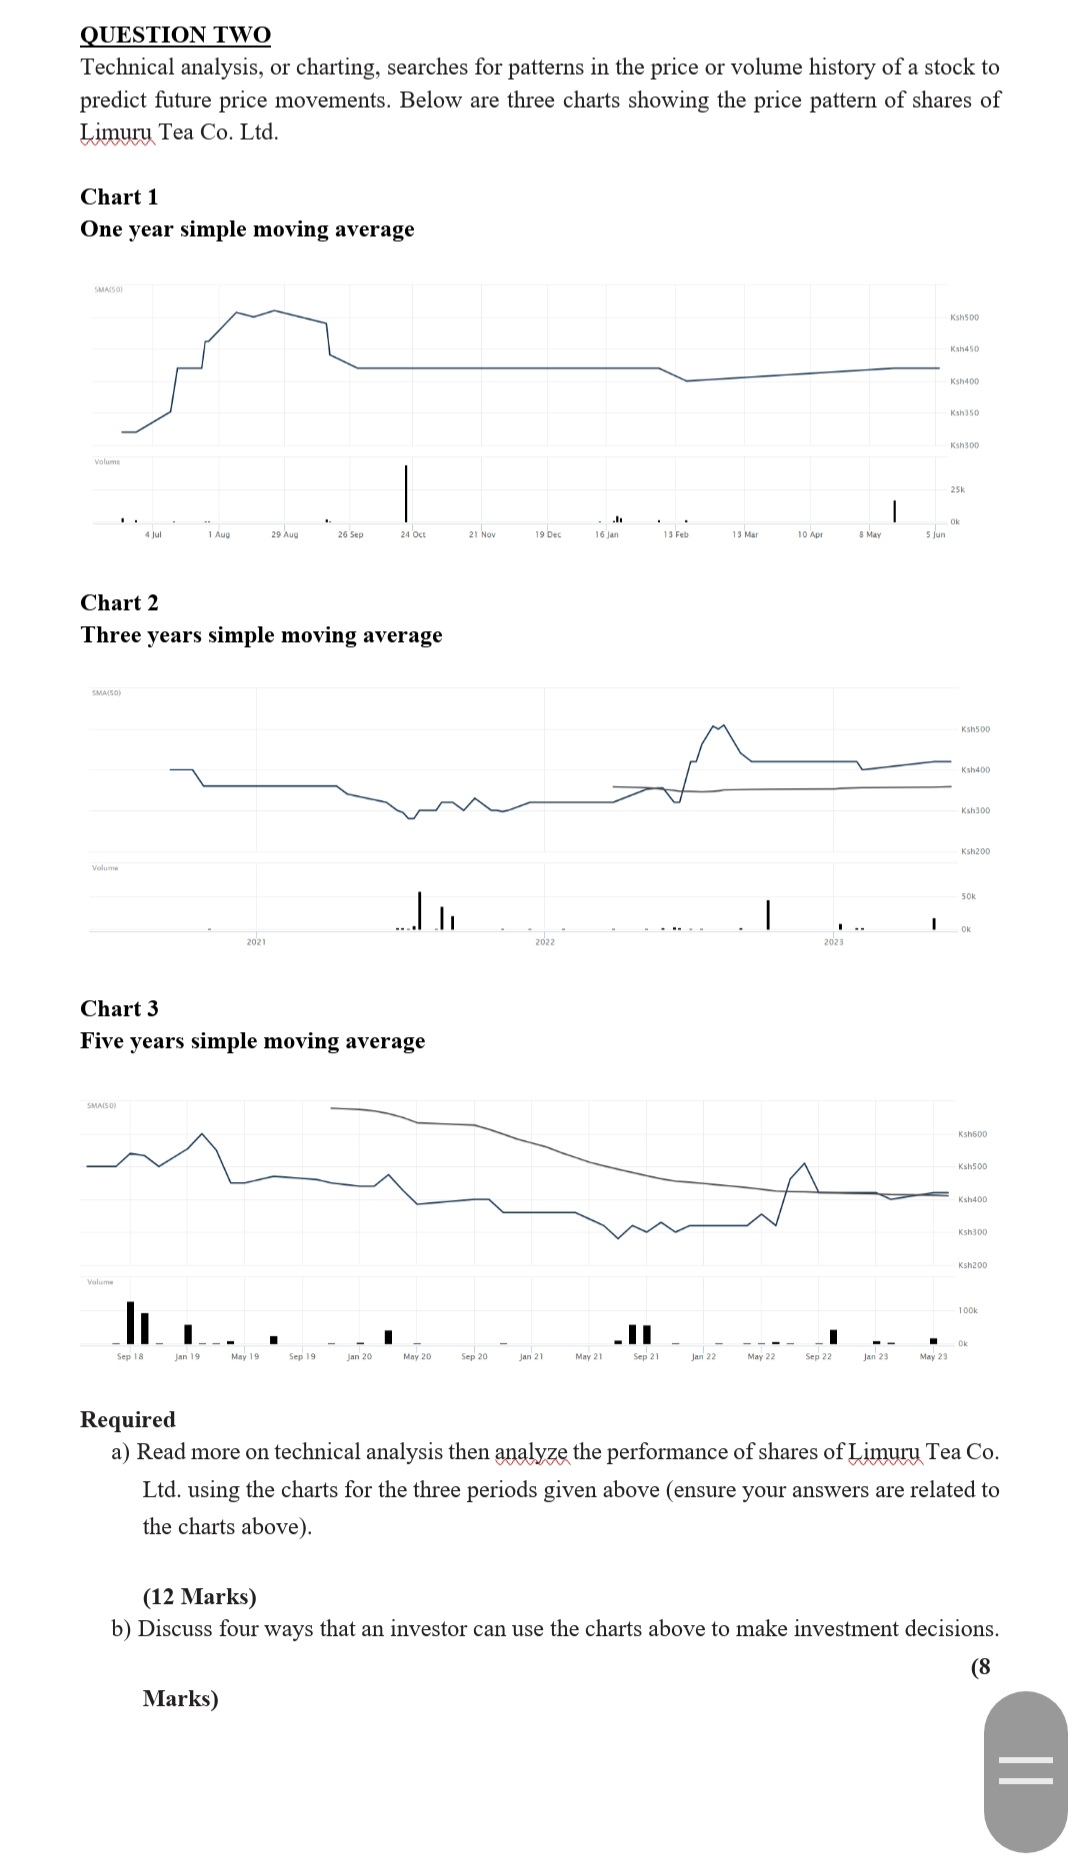
QUESTION TWO Technical analysis, or charting, searches for patterns in the price or volume history of a stock to predict future price movements. Below are three charts showing the price pattern of shares of Limuru Tea Co. Ltd. Chart 1 One year simple moving average Chart 2 Three years simple moving average Chart 3 Five years simple moving average Required a) Read more on technical analysis then analyze the performance of shares of Limuru Tea Co. Ltd. using the charts for the three periods given above (ensure your answers are related to the charts above). (12 Marks) b) Discuss four ways that an investor can use the charts above to make investment decisions. ro
Step by Step Solution
There are 3 Steps involved in it

Get step-by-step solutions from verified subject matter experts