

Question: Technical Analysis: Perform basic technical analysis of the stock using the provided charts on market volume, trading ranges, and pricing trends: 2. Review the four-month
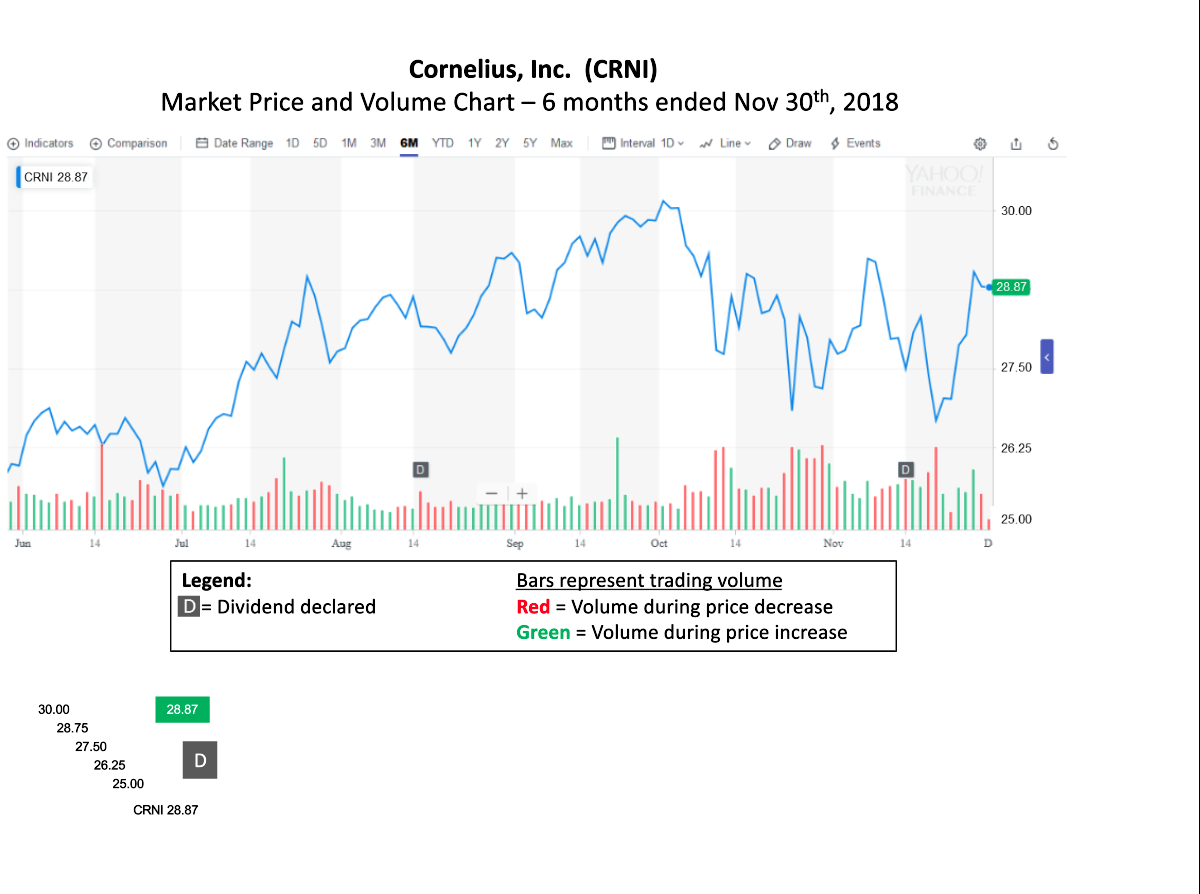
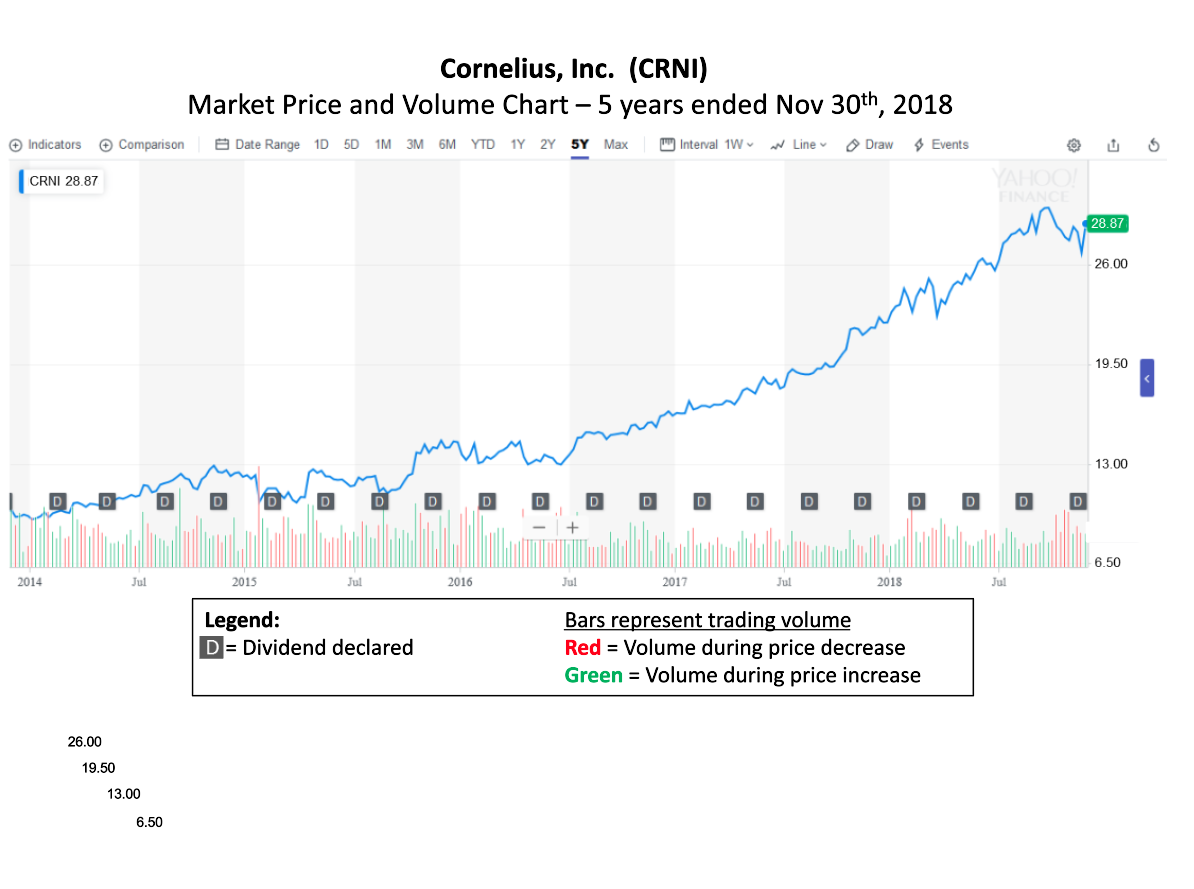
Technical Analysis: Perform basic technical analysis of the stock using the provided charts on market volume, trading ranges, and pricing trends:
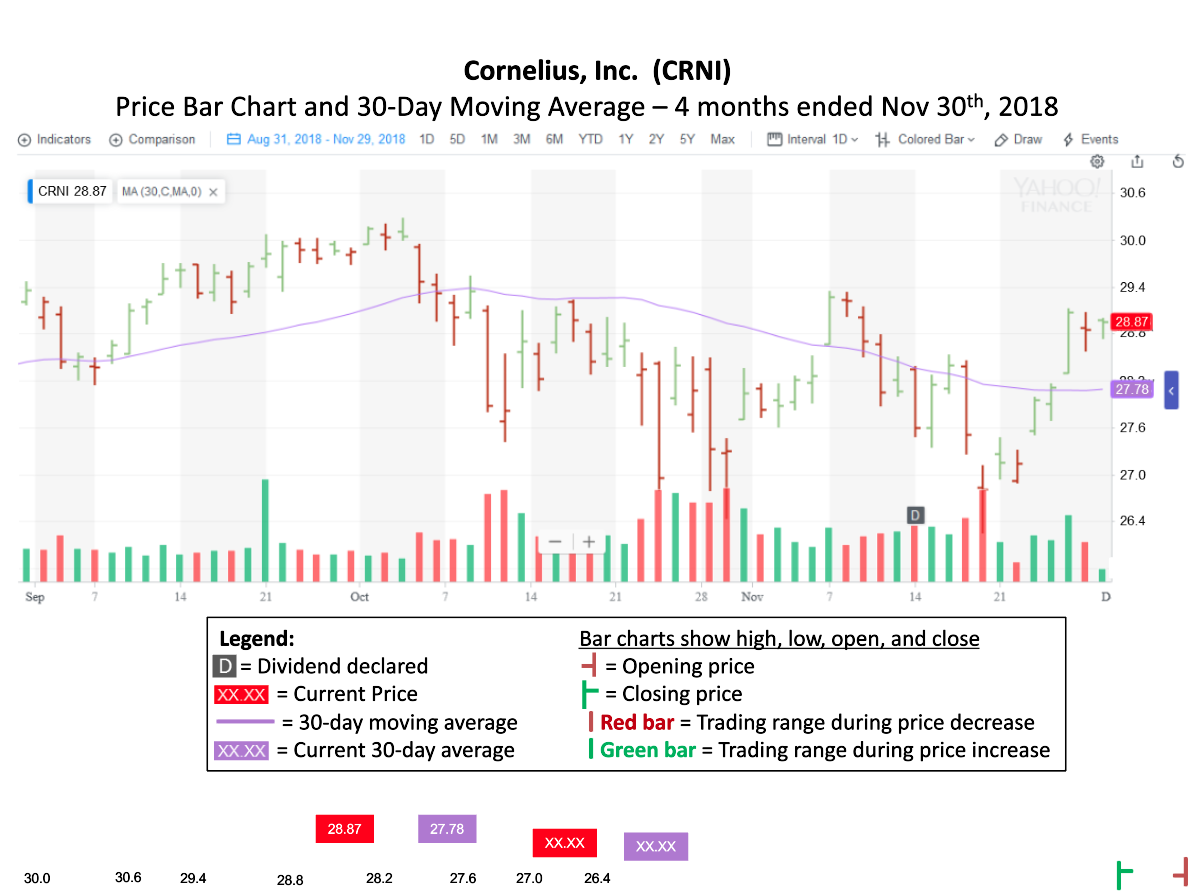
2. Review the four-month trading range and moving average chart. Comment on any patterns, including support or resistance levels, you observe, and how they might inform a buy/sell decision.
Cornelius, Inc. (CRNI) Price Bar Chart and 30-Day Moving Average - 4 months ended Nov 30th, 2018 Indicators Comparison Aug 31, 2018 - Nov 29, 2018 1D 5D 1M 3M 6M YTD 1Y 2Y 5Y Max Interval 1D + Colored Bar Draw Events CRNI 28.87 MA (30.C MAO) X VAHOO 30.6 FINANCE 30.0 574 77 29.4 28.87 20.0 14+1 " 27.78 27.6 27.0 26.4 Hulutl Sep 14 21 Oct 14 21 28 Nov 14 21 Legend: D = Dividend declared XX.XX = Current Price 30-day moving average XX.XX = Current 30-day average Bar charts show high, low, open, and close H = Opening price F = Closing price Red bar = Trading range during price decrease Green bar = Trading range during price increase = 28.87 27.78 XX.XX XX.XX 30.0 30.6 29.4 28.8 28.2 27.6 27.0 26.4 F + Cornelius, Inc. (CRNI) Market Price and Volume Chart - 6 months ended Nov 30th, 2018 Indicators Comparison Date Range 105D 1M 3M 6M YTD 1Y 2Y5Y Max Interval 1D w Line Draw 8 Events CRNI 28.87 YAHOO 30.00 28.87 M 27.50 mu 26.25 D 25.00 Jun 14 Jul 14 Aug 14 Sep 14 Oct 14 Nov 14 D Legend: D = Dividend declared Bars represent trading volume Red = Volume during price decrease Green = Volume during price increase 28.87 30.00 28.75 27.50 26.25 25.00 D CRNI 28.87 Cornelius, Inc. (CRNI) Market Price and Volume Chart - 5 years ended Nov 30th, 2018 Indicators Comparison Date Range 1D 5D 1M 3M 6M YTD 1Y 2Y 5Y Max Interval 1WW Line Draw y Events CRNI 28.87 AHOO 28.87 26.00 man 19.50 13.00 O 6.50 2014 Jul 2015 Jul 2016 Jul 2017 Jul 2018 Jul Legend: D = Dividend declared Bars represent trading volume Red = Volume during price decrease Green = Volume during price increase 26.00 19.50 13.00 6.50 Cornelius, Inc. (CRNI) Price Bar Chart and 30-Day Moving Average - 4 months ended Nov 30th, 2018 Indicators Comparison Aug 31, 2018 - Nov 29, 2018 1D 5D 1M 3M 6M YTD 1Y 2Y 5Y Max Interval 1D + Colored Bar Draw Events CRNI 28.87 MA (30.C MAO) X VAHOO 30.6 FINANCE 30.0 574 77 29.4 28.87 20.0 14+1 " 27.78 27.6 27.0 26.4 Hulutl Sep 14 21 Oct 14 21 28 Nov 14 21 Legend: D = Dividend declared XX.XX = Current Price 30-day moving average XX.XX = Current 30-day average Bar charts show high, low, open, and close H = Opening price F = Closing price Red bar = Trading range during price decrease Green bar = Trading range during price increase = 28.87 27.78 XX.XX XX.XX 30.0 30.6 29.4 28.8 28.2 27.6 27.0 26.4 F + Cornelius, Inc. (CRNI) Market Price and Volume Chart - 6 months ended Nov 30th, 2018 Indicators Comparison Date Range 105D 1M 3M 6M YTD 1Y 2Y5Y Max Interval 1D w Line Draw 8 Events CRNI 28.87 YAHOO 30.00 28.87 M 27.50 mu 26.25 D 25.00 Jun 14 Jul 14 Aug 14 Sep 14 Oct 14 Nov 14 D Legend: D = Dividend declared Bars represent trading volume Red = Volume during price decrease Green = Volume during price increase 28.87 30.00 28.75 27.50 26.25 25.00 D CRNI 28.87 Cornelius, Inc. (CRNI) Market Price and Volume Chart - 5 years ended Nov 30th, 2018 Indicators Comparison Date Range 1D 5D 1M 3M 6M YTD 1Y 2Y 5Y Max Interval 1WW Line Draw y Events CRNI 28.87 AHOO 28.87 26.00 man 19.50 13.00 O 6.50 2014 Jul 2015 Jul 2016 Jul 2017 Jul 2018 Jul Legend: D = Dividend declared Bars represent trading volume Red = Volume during price decrease Green = Volume during price increase 26.00 19.50 13.00 6.50
Step by Step Solution
There are 3 Steps involved in it

Get step-by-step solutions from verified subject matter experts