

Question: Tell whether a correlation Is likely in the situation. If so, tell whether there is a causal relationship. Explain your reasoning. 4 13. the amount
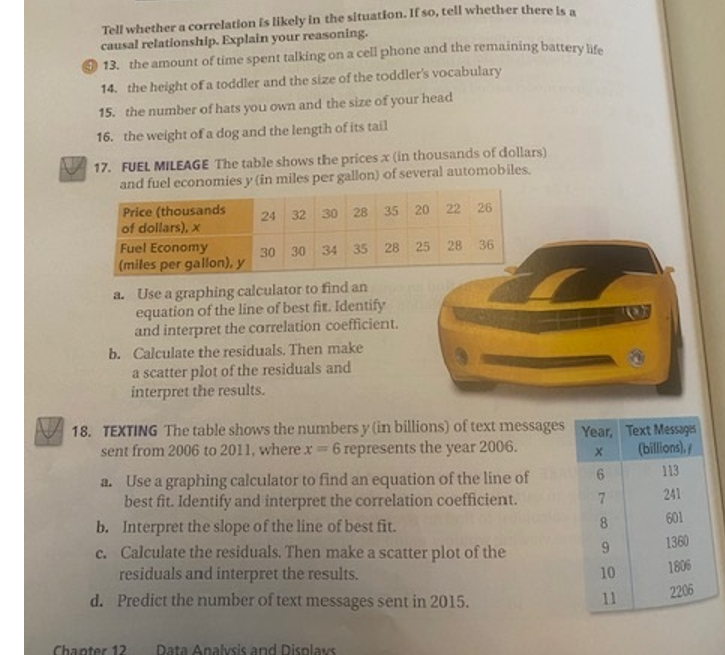
Tell whether a correlation Is likely in the situation. If so, tell whether there is a causal relationship. Explain your reasoning. 4 13. the amount of time spent talking on a cell phone and the remaining battery life 14. the height of a toddler and the size of the toddler's vocabulary 15. the number of hats you own and the size of your head 16. the weight of a dog and the length of its tail V 17. FUEL MILEAGE The table shows the prices x (in thousands of dollars) and fuel economies y (in miles per gallon) of several automobiles. Price (thousands 30 28 of dollars), x 24 32 35 20 22 26 Fuel Economy 30 30 34 35 28 25 28 (miles per gallon), y 36 a. Use a graphing calculator to find an equation of the line of best fit. Identify and interpret the correlation coefficient. b. Calculate the residuals. Then make a scatter plot of the residuals and interpret the results. 18. TEXTING The table shows the numbers y (in billions) of text messages sent from 2006 to 2011, where x = 6 represents the year 2006. Year, Text Messages X (billions)./ a. Use a graphing calculator to find an equation of the line of 113 best fit. Identify and interpret the correlation coefficient. 7 241 b. Interpret the slope of the line of best fit. 8 601 c. Calculate the residuals, Then make a scatter plot of the 9 1360 residuals and interpret the results. 10 1806 d. Predict the number of text messages sent in 2015. 11 2206 Data Analysis and Displays
Step by Step Solution
There are 3 Steps involved in it

Get step-by-step solutions from verified subject matter experts