

Question: Ten protype units are tested to failure during a reliability demonstration test series. The units were continuously monitored and failure times were recorded. The table
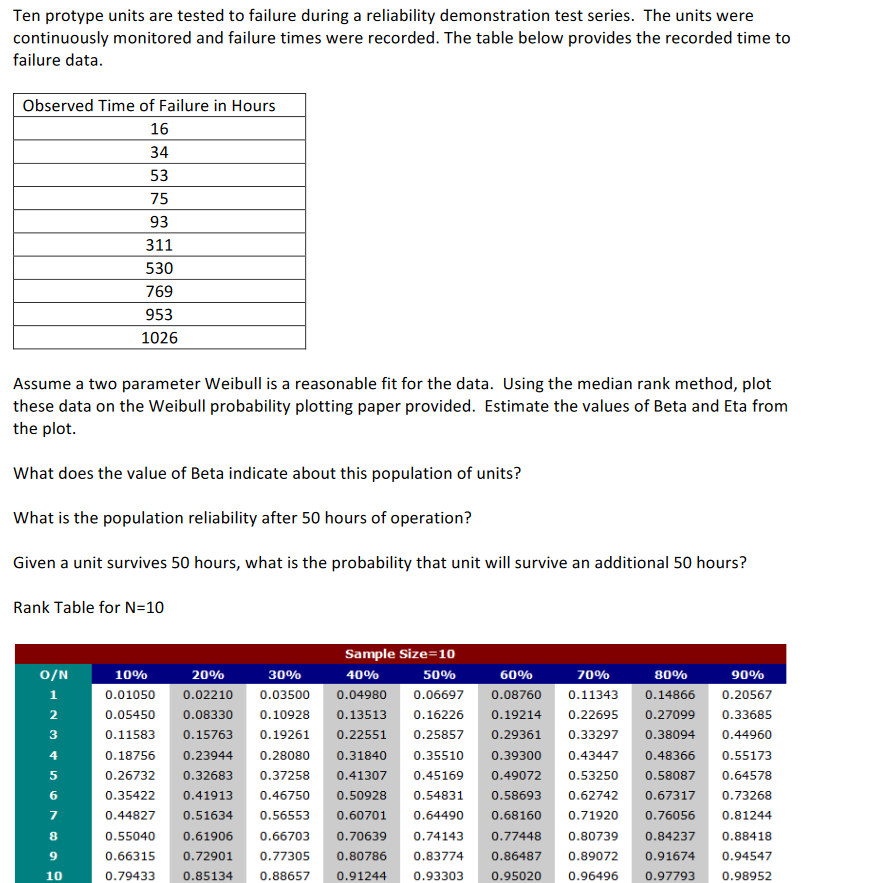
Ten protype units are tested to failure during a reliability demonstration test series. The units were continuously monitored and failure times were recorded. The table below provides the recorded time to failure data. Observed Time of Failure in Hours 16 34 53 75 93 311 530 769 953 1026 Assume a two parameter Weibull is a reasonable fit for the data. Using the median rank method, plot these data on the Weibull probability plotting paper provided. Estimate the values of Beta and Eta from the plot. What does the value of Beta indicate about this population of units? What is the population reliability after 50 hours of operation? Given a unit survives 50 hours, what is the probability that unit will survive an additional 50 hours? Rank Table for N=10 O/N 1 80% 0.14866 0.27099 0.38094 2 10% 0.01050 0.05450 0.11583 0.18756 0.26732 0.35422 3 30% 0.03500 0.10928 0.19261 0.28080 0.37258 0.46750 0.56553 4 20% 0.02210 0.08330 0.15763 0.23944 0.32683 0.41913 0.51634 0.61906 0.72901 0.85134 Sample Size=10 40% 50% 0.04980 0.06697 0.13513 0.16226 0.22551 0.25857 0.31840 0.35510 0.41307 0.45169 0.50928 0.54831 0.60701 0.64490 0.70639 0.74143 0.80786 0.83774 0.91244 0.93303 5 60% 0.08760 0.19214 0.29361 0.39300 0.49072 0.58693 0.68160 0.77448 0.86487 0.95020 70% 0.11343 0.22695 0.33297 0.43447 0.53250 0.62742 0.71920 0.80739 0.89072 0.96496 0.48366 0.58087 0.67317 0.76056 90% 0.20567 0.33685 0.44960 0.55173 0.64578 0.73268 0.81244 0.88418 0.94547 0.98952 6 7 0.44827 8 9 0.55040 0.66315 0.79433 0.66703 0.77305 0.88657 0.84237 0.91674 0.97793 10 Ten protype units are tested to failure during a reliability demonstration test series. The units were continuously monitored and failure times were recorded. The table below provides the recorded time to failure data. Observed Time of Failure in Hours 16 34 53 75 93 311 530 769 953 1026 Assume a two parameter Weibull is a reasonable fit for the data. Using the median rank method, plot these data on the Weibull probability plotting paper provided. Estimate the values of Beta and Eta from the plot. What does the value of Beta indicate about this population of units? What is the population reliability after 50 hours of operation? Given a unit survives 50 hours, what is the probability that unit will survive an additional 50 hours? Rank Table for N=10 O/N 1 80% 0.14866 0.27099 0.38094 2 10% 0.01050 0.05450 0.11583 0.18756 0.26732 0.35422 3 30% 0.03500 0.10928 0.19261 0.28080 0.37258 0.46750 0.56553 4 20% 0.02210 0.08330 0.15763 0.23944 0.32683 0.41913 0.51634 0.61906 0.72901 0.85134 Sample Size=10 40% 50% 0.04980 0.06697 0.13513 0.16226 0.22551 0.25857 0.31840 0.35510 0.41307 0.45169 0.50928 0.54831 0.60701 0.64490 0.70639 0.74143 0.80786 0.83774 0.91244 0.93303 5 60% 0.08760 0.19214 0.29361 0.39300 0.49072 0.58693 0.68160 0.77448 0.86487 0.95020 70% 0.11343 0.22695 0.33297 0.43447 0.53250 0.62742 0.71920 0.80739 0.89072 0.96496 0.48366 0.58087 0.67317 0.76056 90% 0.20567 0.33685 0.44960 0.55173 0.64578 0.73268 0.81244 0.88418 0.94547 0.98952 6 7 0.44827 8 9 0.55040 0.66315 0.79433 0.66703 0.77305 0.88657 0.84237 0.91674 0.97793 10
Step by Step Solution
There are 3 Steps involved in it

Get step-by-step solutions from verified subject matter experts