

Question: Ten Year Starting Now Point to Plot Period (yrs) Rate of Change Population Population/Rounded 50 (0, 50) 0-10 50 0.0894 54.47/55 (10, 55) 11-20 55
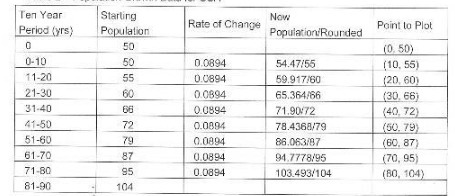
Ten Year Starting Now Point to Plot Period (yrs) Rate of Change Population Population/Rounded 50 (0, 50) 0-10 50 0.0894 54.47/55 (10, 55) 11-20 55 D.C894 59.917/60 (20, 60) 21-30 60 0.0894 65.364/66 (30. 66 31-40 0.0894 71.90/72 (40 72) 41-50 72 010804 78.4368/79 160. 79 51-60 79 0.0894 86.063/87 (60. 87) 61-70 87 0.0894 94.7778/95 (70, 95 71-80 85 0.0894 103.493/104 (80, 104) 81-90 104
Step by Step Solution
There are 3 Steps involved in it
1 Expert Approved Answer
Step: 1 Unlock

Question Has Been Solved by an Expert!
Get step-by-step solutions from verified subject matter experts
Step: 2 Unlock
Step: 3 Unlock