

Question: TER OT ies INSTRUCTOR SUPPORT STUDENT SUPPORT OS Assume that this is the output of a regression for Darnell products: SUMMARY OUTPUT Regression Statistics Multiple
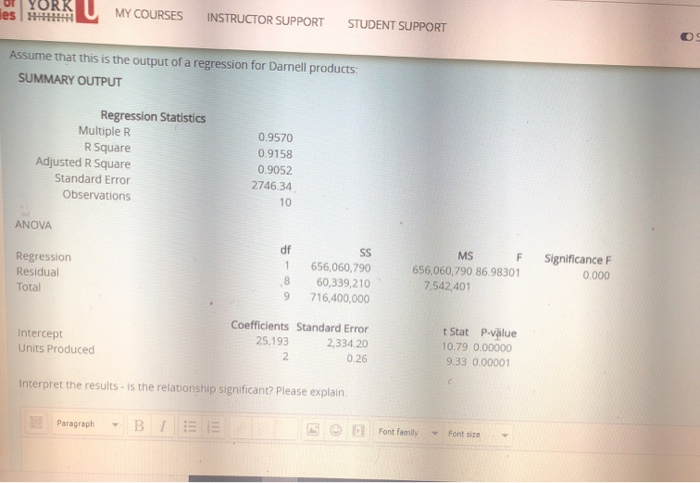
TER OT ies INSTRUCTOR SUPPORT STUDENT SUPPORT OS Assume that this is the output of a regression for Darnell products: SUMMARY OUTPUT Regression Statistics Multiple R R Square Adjusted R Square Standard Error Observations 0.9570 0.9158 0.9052 2746.34 10 ANOVA df 1 Regression Residual Total SS 656,060,790 60,339,210 716,400,000 MS F 656,060,790 86.98301 7,542,401 Significance F 0.000 8 9 Intercept Units Produced Coefficients Standard Error 25,193 2,334 20 2 0.26 t Stat P-value 10.79 0.00000 9.33 0.00001 Interpret the results is the relationship significant? Please explain Paragraph BIE Font family Font Site TER OT ies INSTRUCTOR SUPPORT STUDENT SUPPORT OS Assume that this is the output of a regression for Darnell products: SUMMARY OUTPUT Regression Statistics Multiple R R Square Adjusted R Square Standard Error Observations 0.9570 0.9158 0.9052 2746.34 10 ANOVA df 1 Regression Residual Total SS 656,060,790 60,339,210 716,400,000 MS F 656,060,790 86.98301 7,542,401 Significance F 0.000 8 9 Intercept Units Produced Coefficients Standard Error 25,193 2,334 20 2 0.26 t Stat P-value 10.79 0.00000 9.33 0.00001 Interpret the results is the relationship significant? Please explain Paragraph BIE Font family Font Site
Step by Step Solution
There are 3 Steps involved in it

Get step-by-step solutions from verified subject matter experts