

Question: terval X VA Cengage Learning X Mail - Jesson Anderson - Outloo X BE spec-report-jesson-anderson-2- https://myclassroom.apus.edu/d21/le/enhancedSequenceViewer/55651?url=https%3A%2F%2Ff54cbe36-23a9-4505-85fe-e25 1f8 W6: Confidence Interval W6: Confidence Interval Initial Post
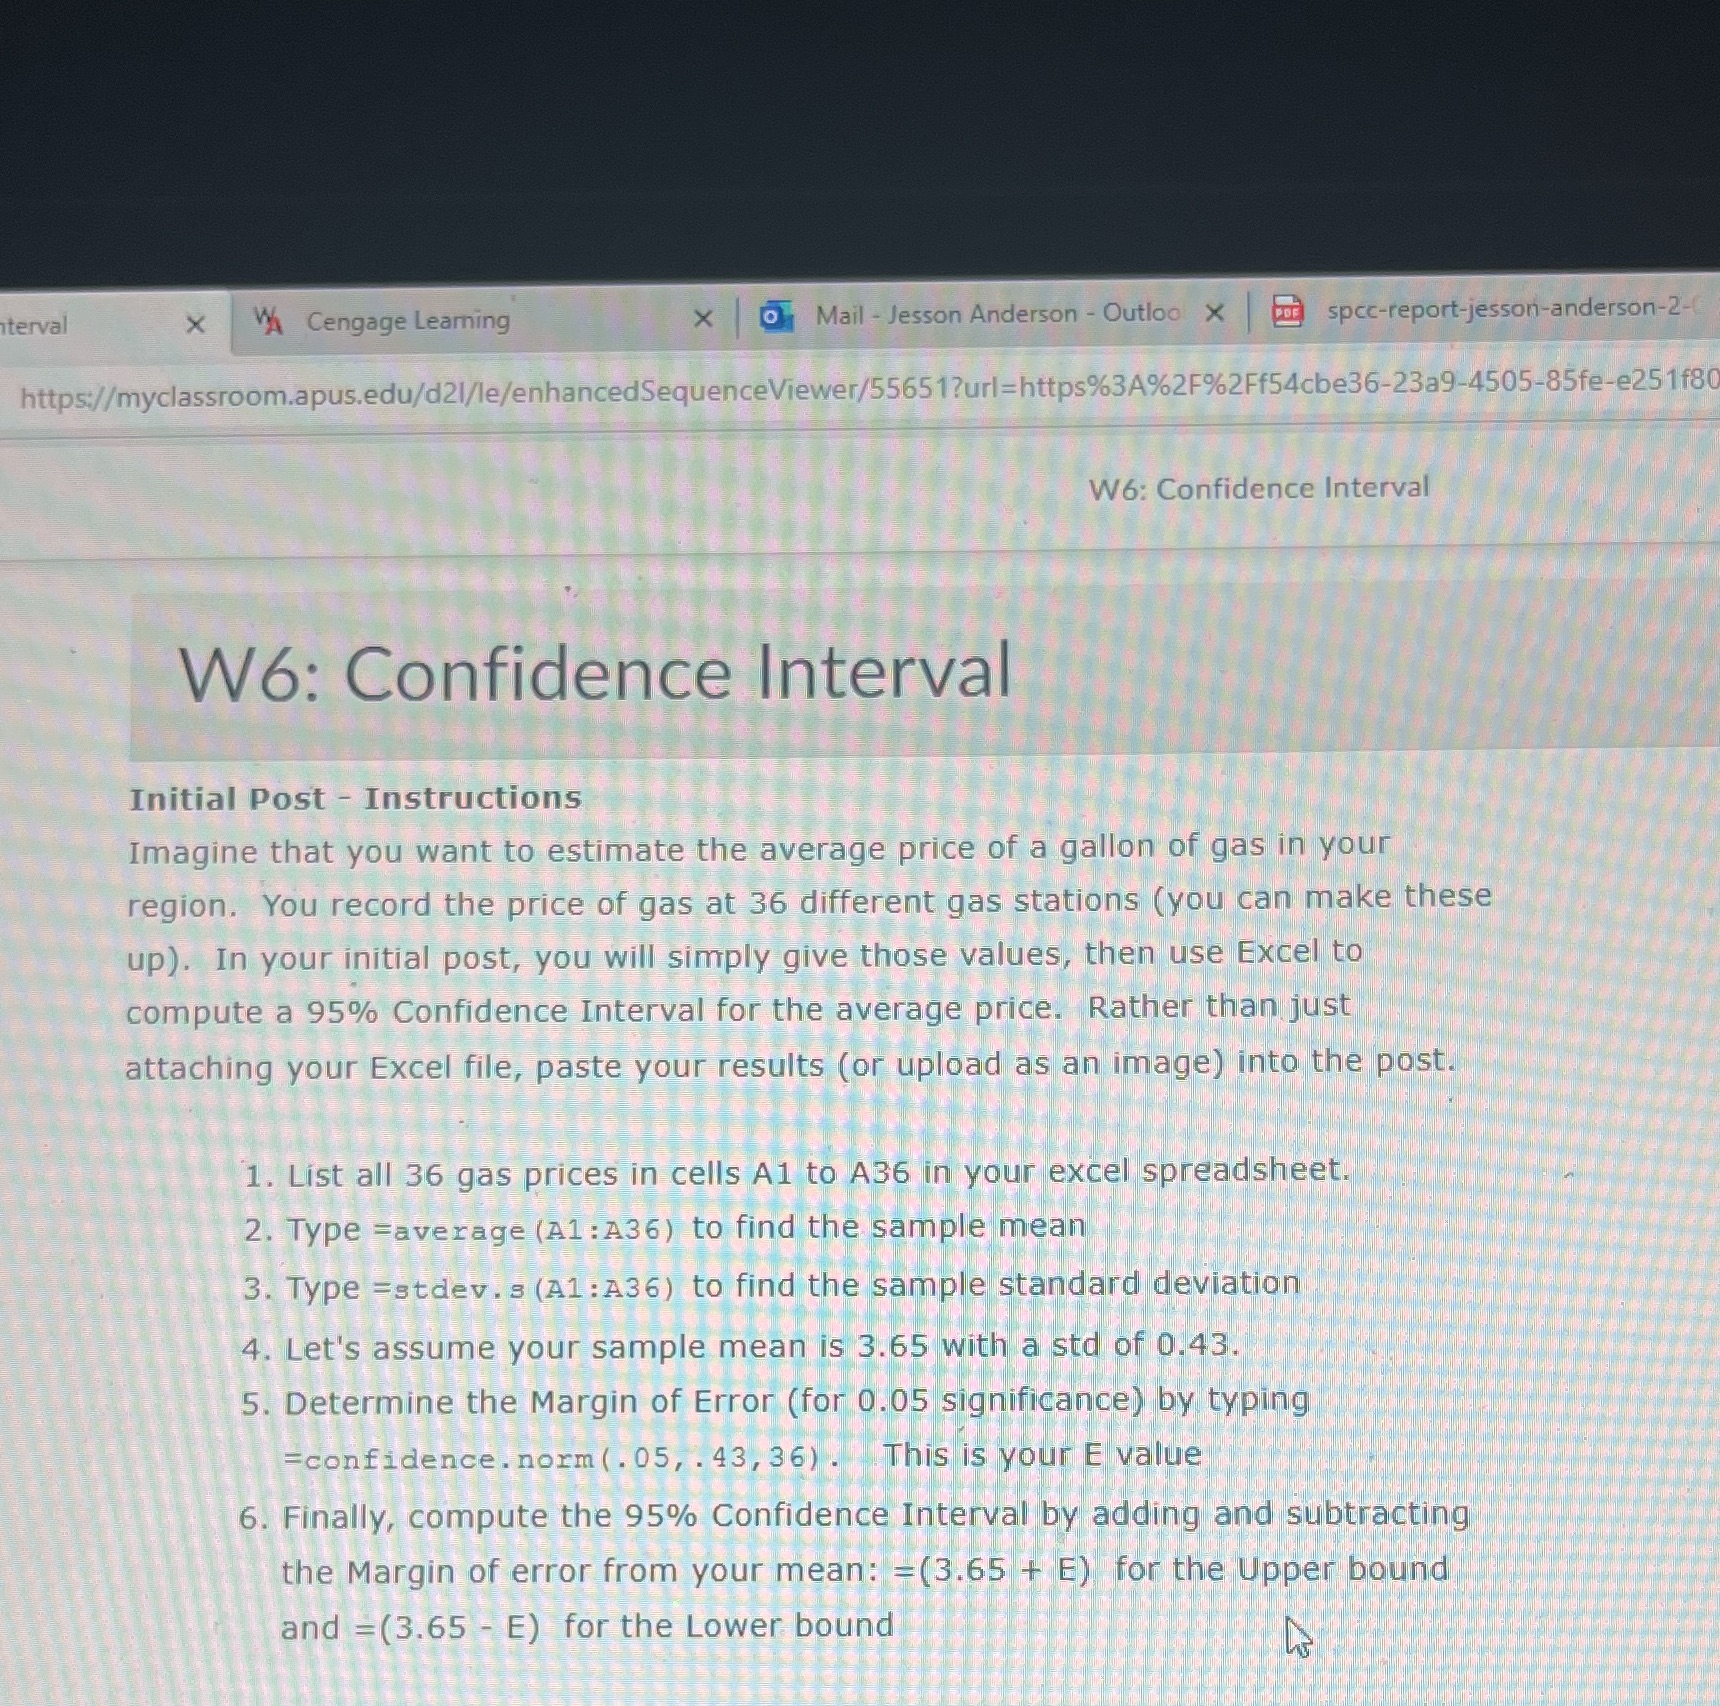
terval X VA Cengage Learning X Mail - Jesson Anderson - Outloo X BE spec-report-jesson-anderson-2- https://myclassroom.apus.edu/d21/le/enhancedSequenceViewer/55651?url=https%3A%2F%2Ff54cbe36-23a9-4505-85fe-e25 1f8 W6: Confidence Interval W6: Confidence Interval Initial Post - Instructions Imagine that you want to estimate the average price of a gallon of gas in your region. You record the price of gas at 36 different gas stations ( you can make these up). In your initial post, you will simply give those values, then use Excel to compute a 95% Confidence Interval for the average price. . Rather than just attaching your Excel file, paste your results (or upload as an image) into the post. 1. List all 36 gas prices in cells A1 to A36 in your excel spreadsheet. 2. Type =average (A1: A36) to find the sample mean 3. Type =stdev. s (A1: A36) to find the sample standard deviation 4. Let's assume your sample mean is 3.65 with a sto of 0.43. 5. Determine the Margin of Error (for 0.05 significance) by typing =confidence . norm ( . 05, . 43, 36) ! : This is your E value 6. Finally, compute the 95% Confidence Interval by adding and subtracting the Margin of error from your mean: -(3.65 + E) for the Upper bound and =(3.65 - E) for the Lower bound
Step by Step Solution
There are 3 Steps involved in it

Get step-by-step solutions from verified subject matter experts