

Question: Simple Linear Regression The Public Service Electric Company produces different quantities of electricity each month depending on demand. The file A4 S2 2020.xls lists
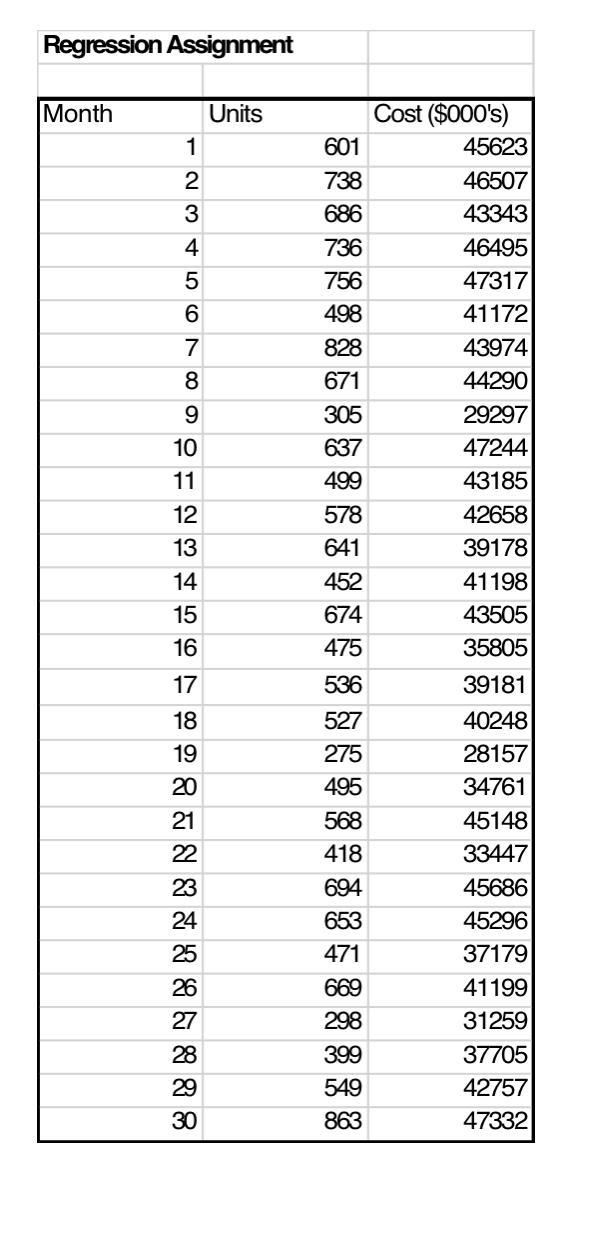
Simple Linear Regression The Public Service Electric Company produces different quantities of electricity each month depending on demand. The file A4 S2 2020.xls lists the number of units of electricity produced (Units) and the total cost of producing these (Cost) for a 30-month period. (a) Produce a scatter plot of the data with the predictor variable (Units) on the horizontal axis. [4 marks] (b) Describe the type of relationship that appears to exist between the two variables. [4 marks] (c) Generate the simple linear regression output for the data. [As a check, make sure that the number at the top of the output, Multiple R, is equal to 0.86078.] Write down the line of best fit. [4 marks] (d) What are the values of the slope and the intercept for the line of best fit? Interpret these values. Does the intercept have a reliable interpretation? Explain briefly. [6 marks] (e) What is the value of the coefficient of determination? Interpret this value. [5 marks] (f) (g) What is the value of the correlation coefficient? Interpret this value. [4 marks] Test (by comparing the test statistic to the critical value) whether there is a significant positive linear relationship between Units and Cost at the 5% level of significance. [5 marks] (h) Test (using the p-value) whether there is a significant positive linear relationship between Units and Cost at the 1% level of significance. [5 marks] (i) Show the working for 90% confidence interval for the population slope. [4 marks] (i) Suppose that 777 units of electricity were produced in a particular month at the Public Service Electric Company. What cost would your model predict for this month? Comment briefly on the accuracy and reliability of this prediction. [5 marks] Regression Assignment Month Units 1 23456 7 8 9 10 11 2345678 2 8787888 12 13 14 15 16 17 18 19 20 21 22 23 24 25 26 27 28 29 30 601 738 686 736 756 498 828 671 305 637 499 578 641 452 674 475 536 527 275 495 568 418 694 653 471 669 298 399 549 863 Cost ($000's) 45623 46507 43343 46495 47317 41172 43974 44290 29297 47244 43185 42658 39178 41198 43505 35805 39181 40248 28157 34761 45148 33447 45686 45296 37179 41199 31259 37705 42757 47332
Step by Step Solution
3.39 Rating (155 Votes )
There are 3 Steps involved in it
The data given is the number of units electricity produced and the total cost pro... View full answer

Get step-by-step solutions from verified subject matter experts