

Question: Test Decision: Compare the relationship between the p value and the significance level, and decide to reject or fail to reject the null hypothesis.
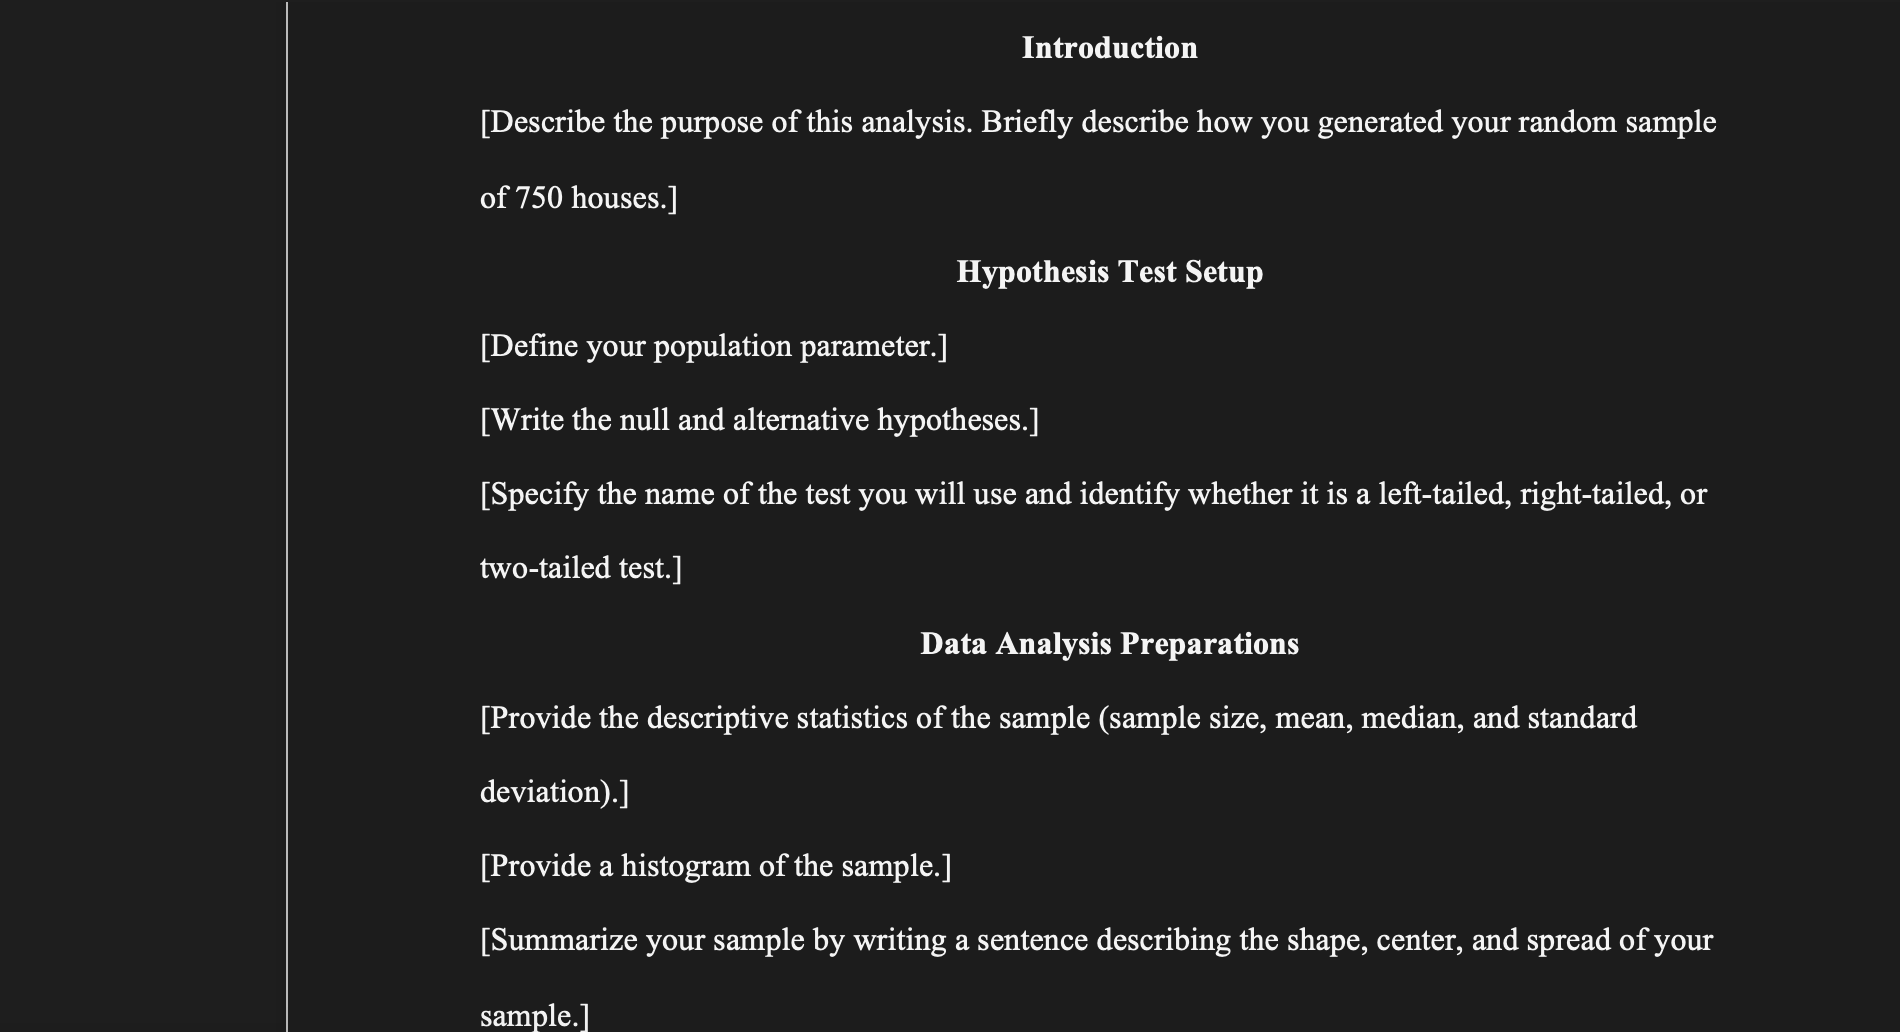
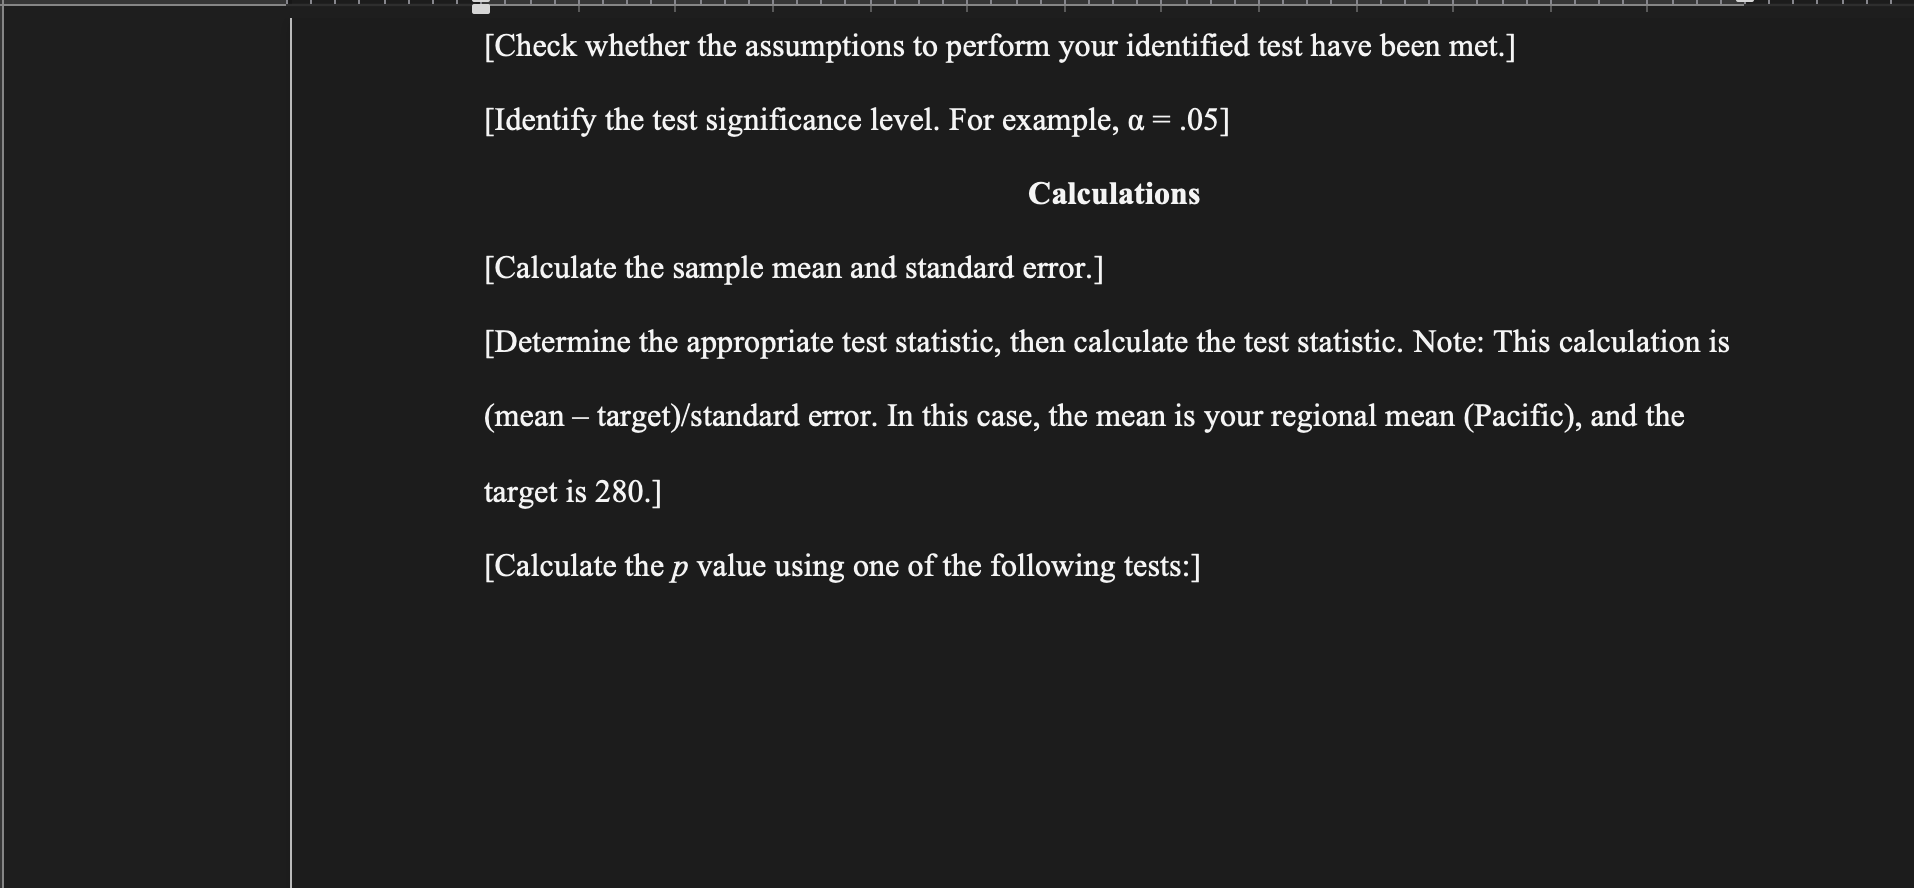
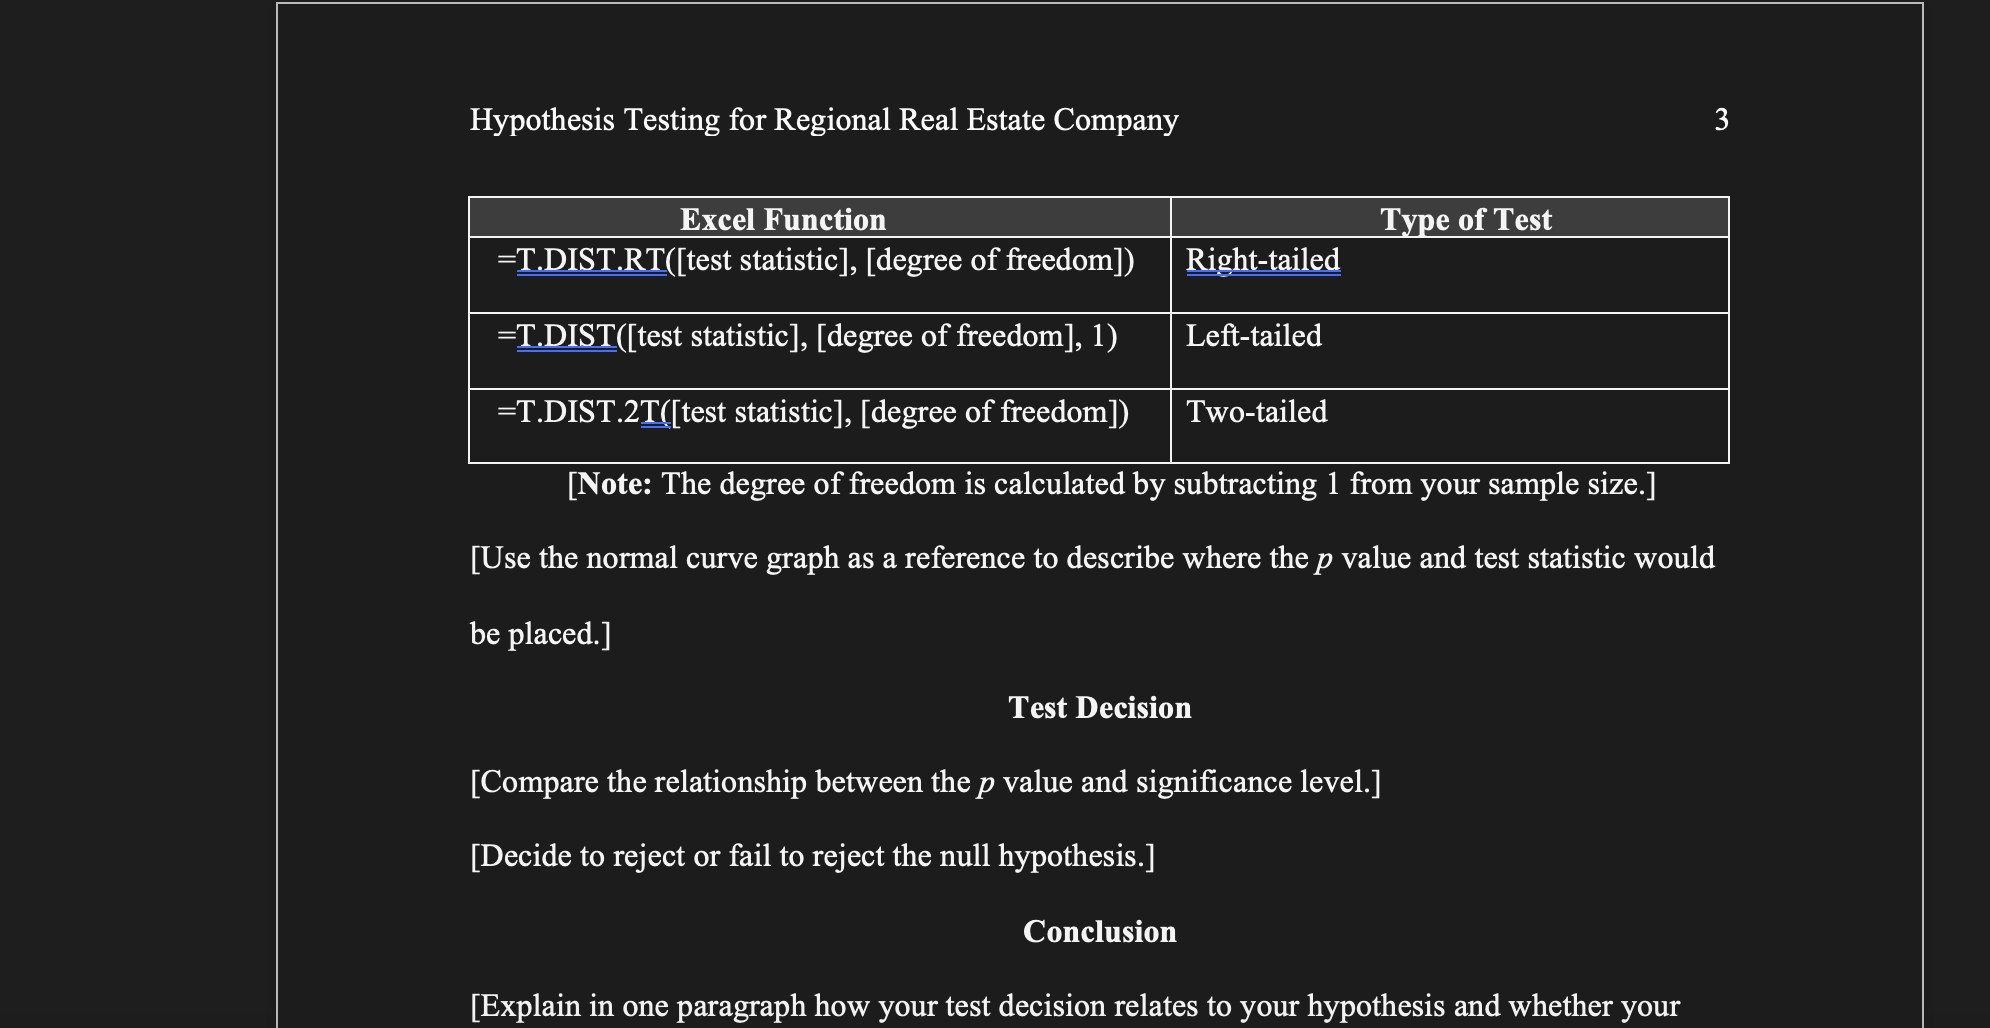
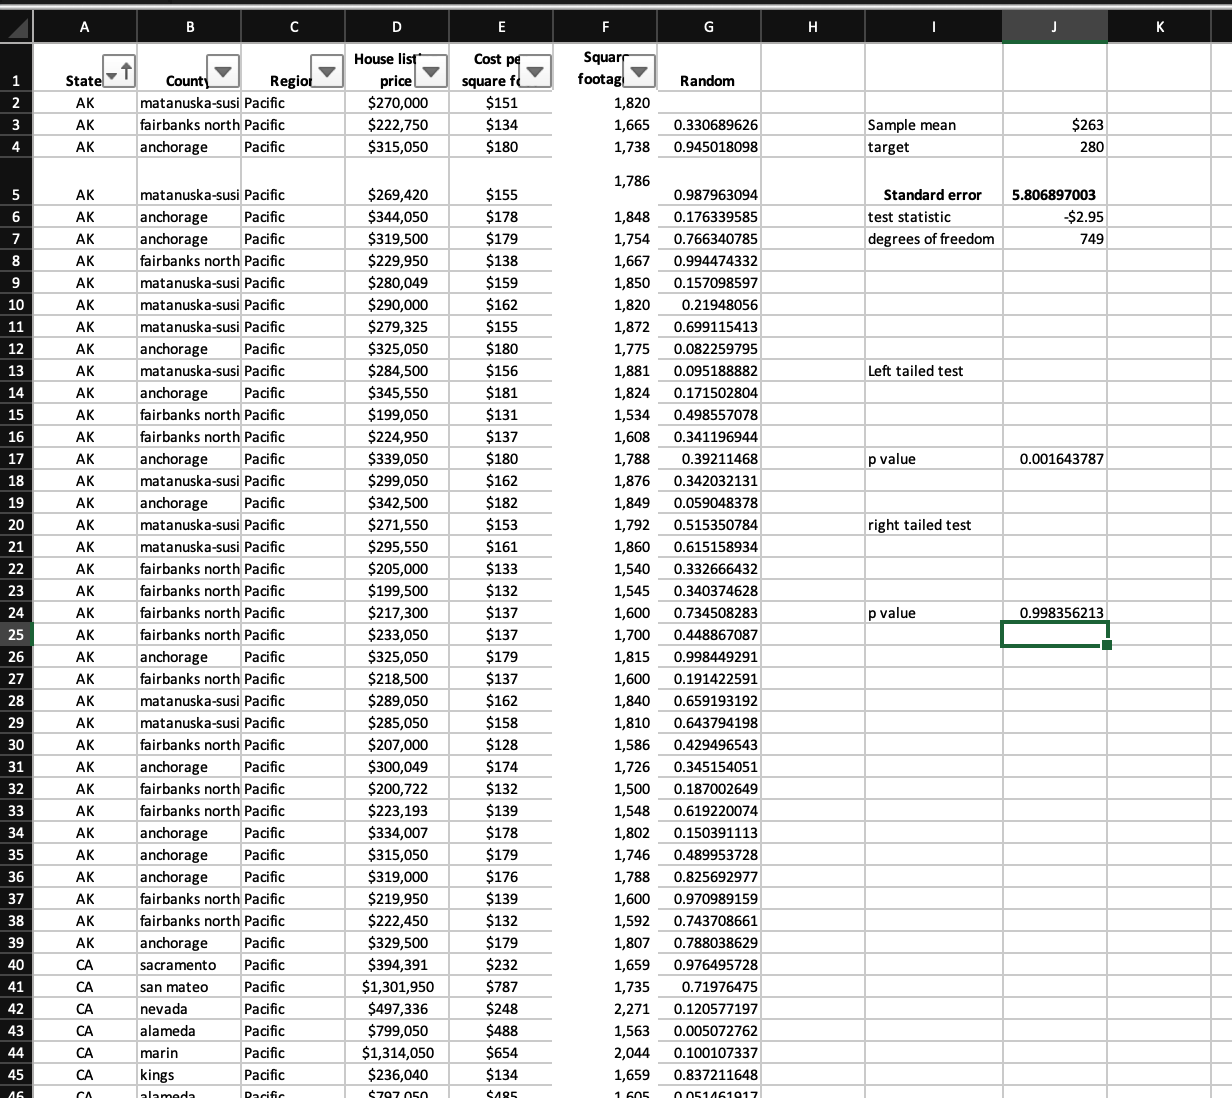
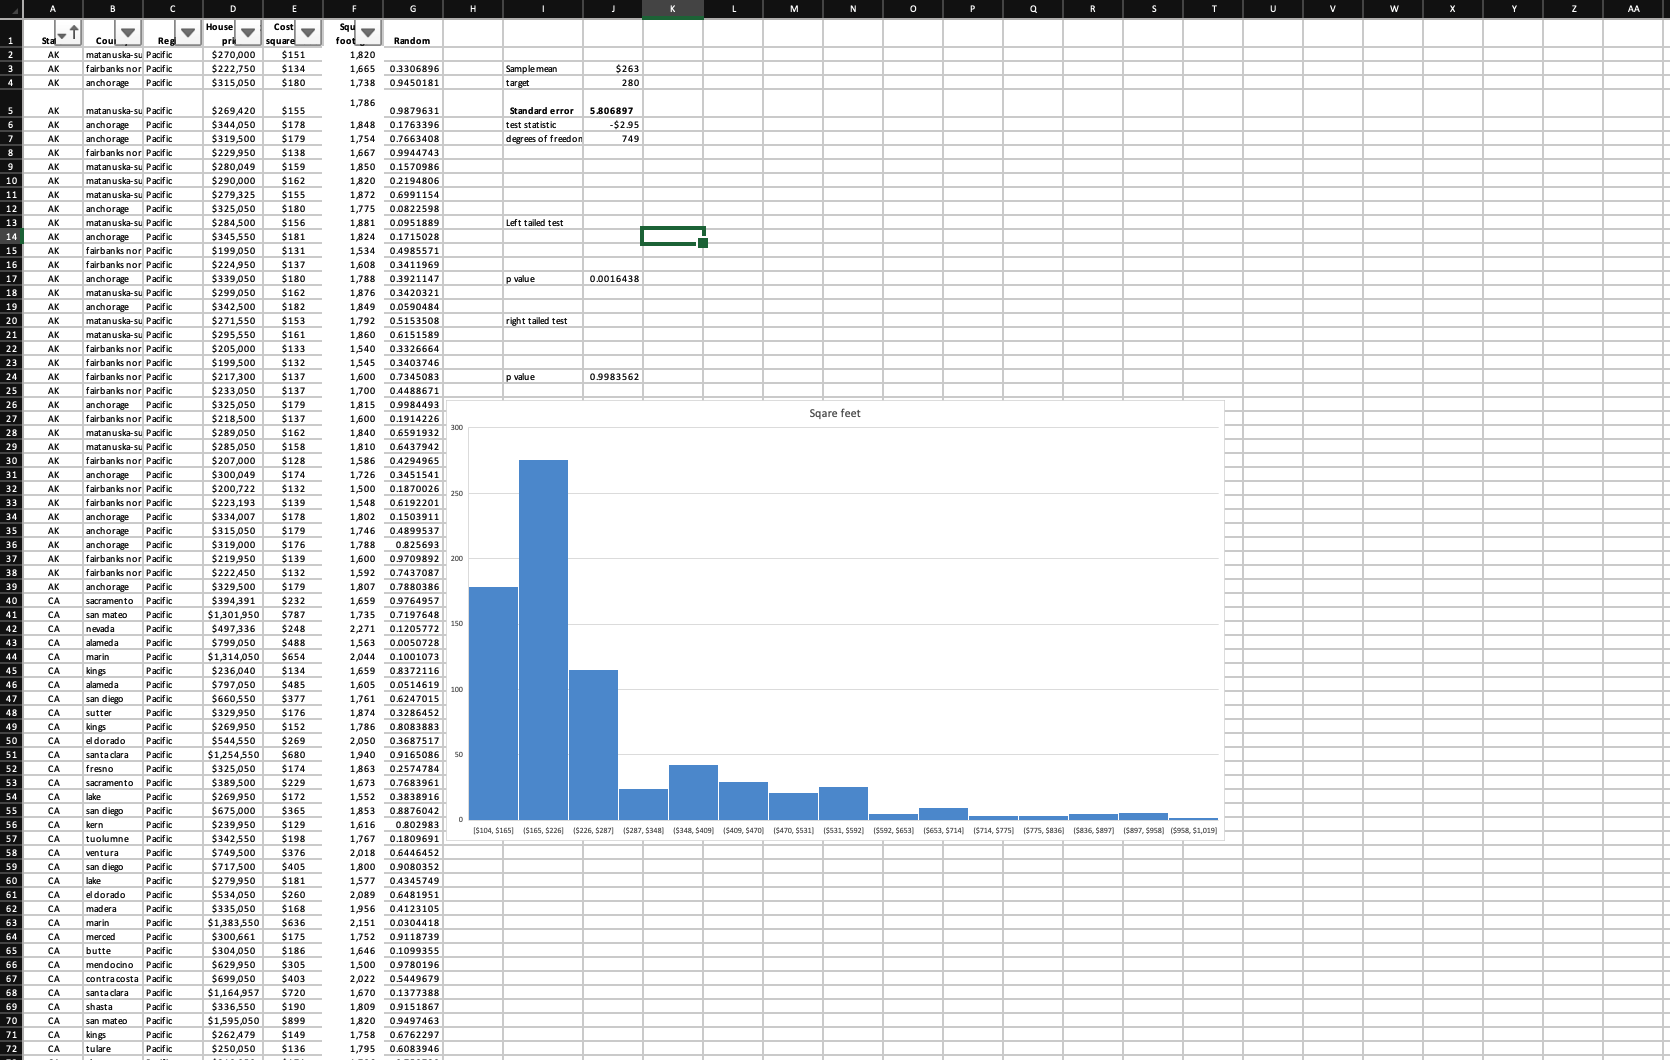
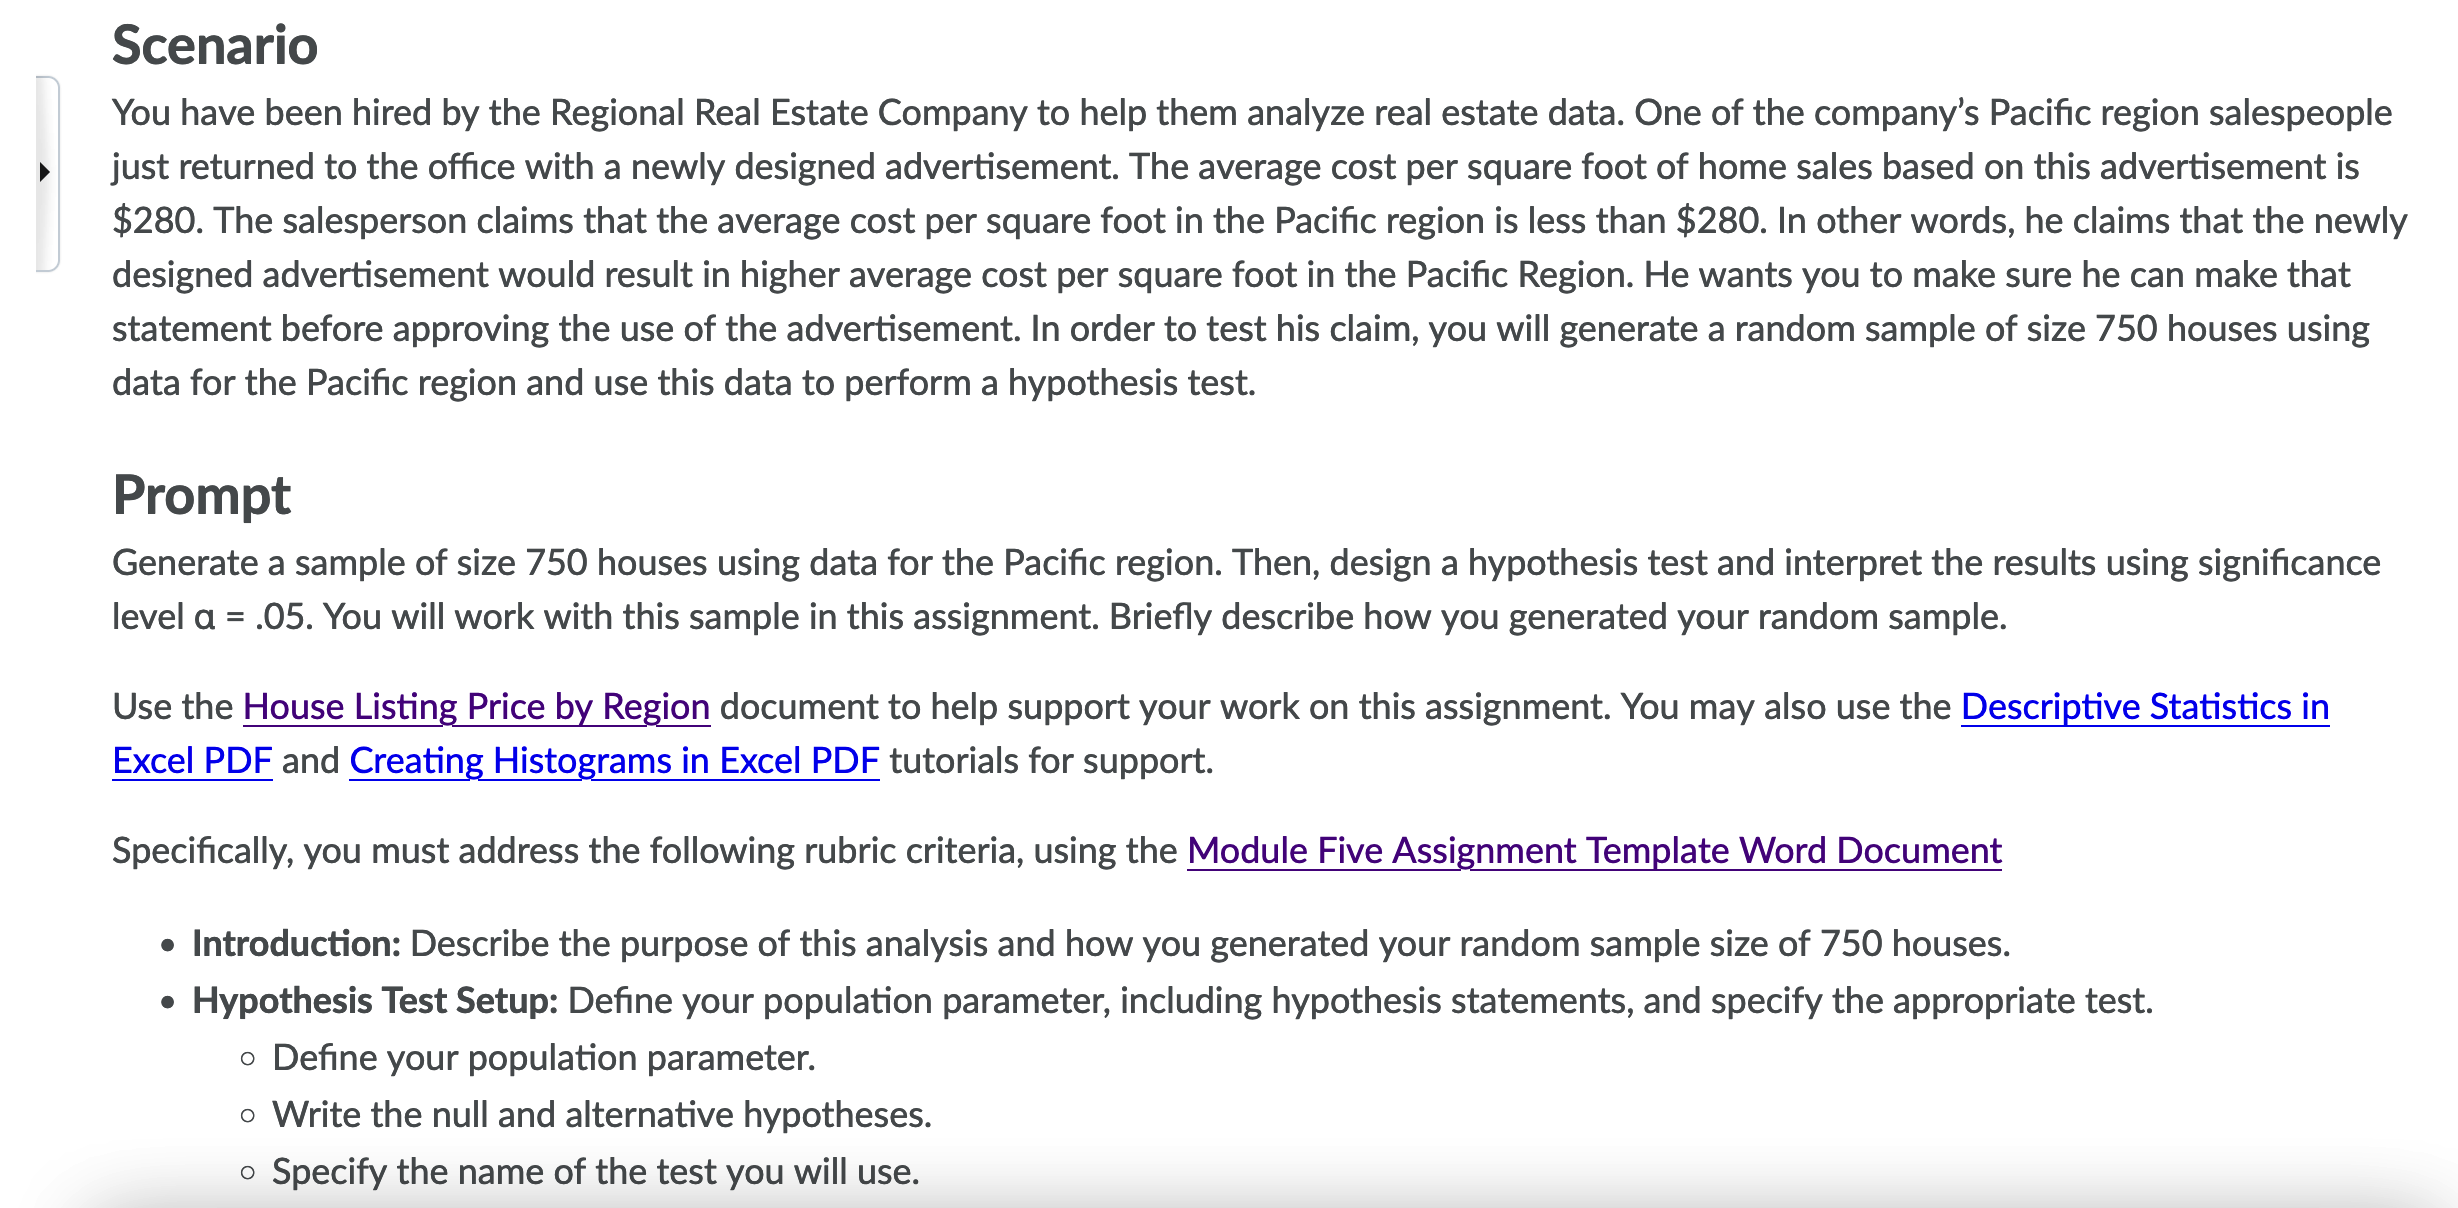
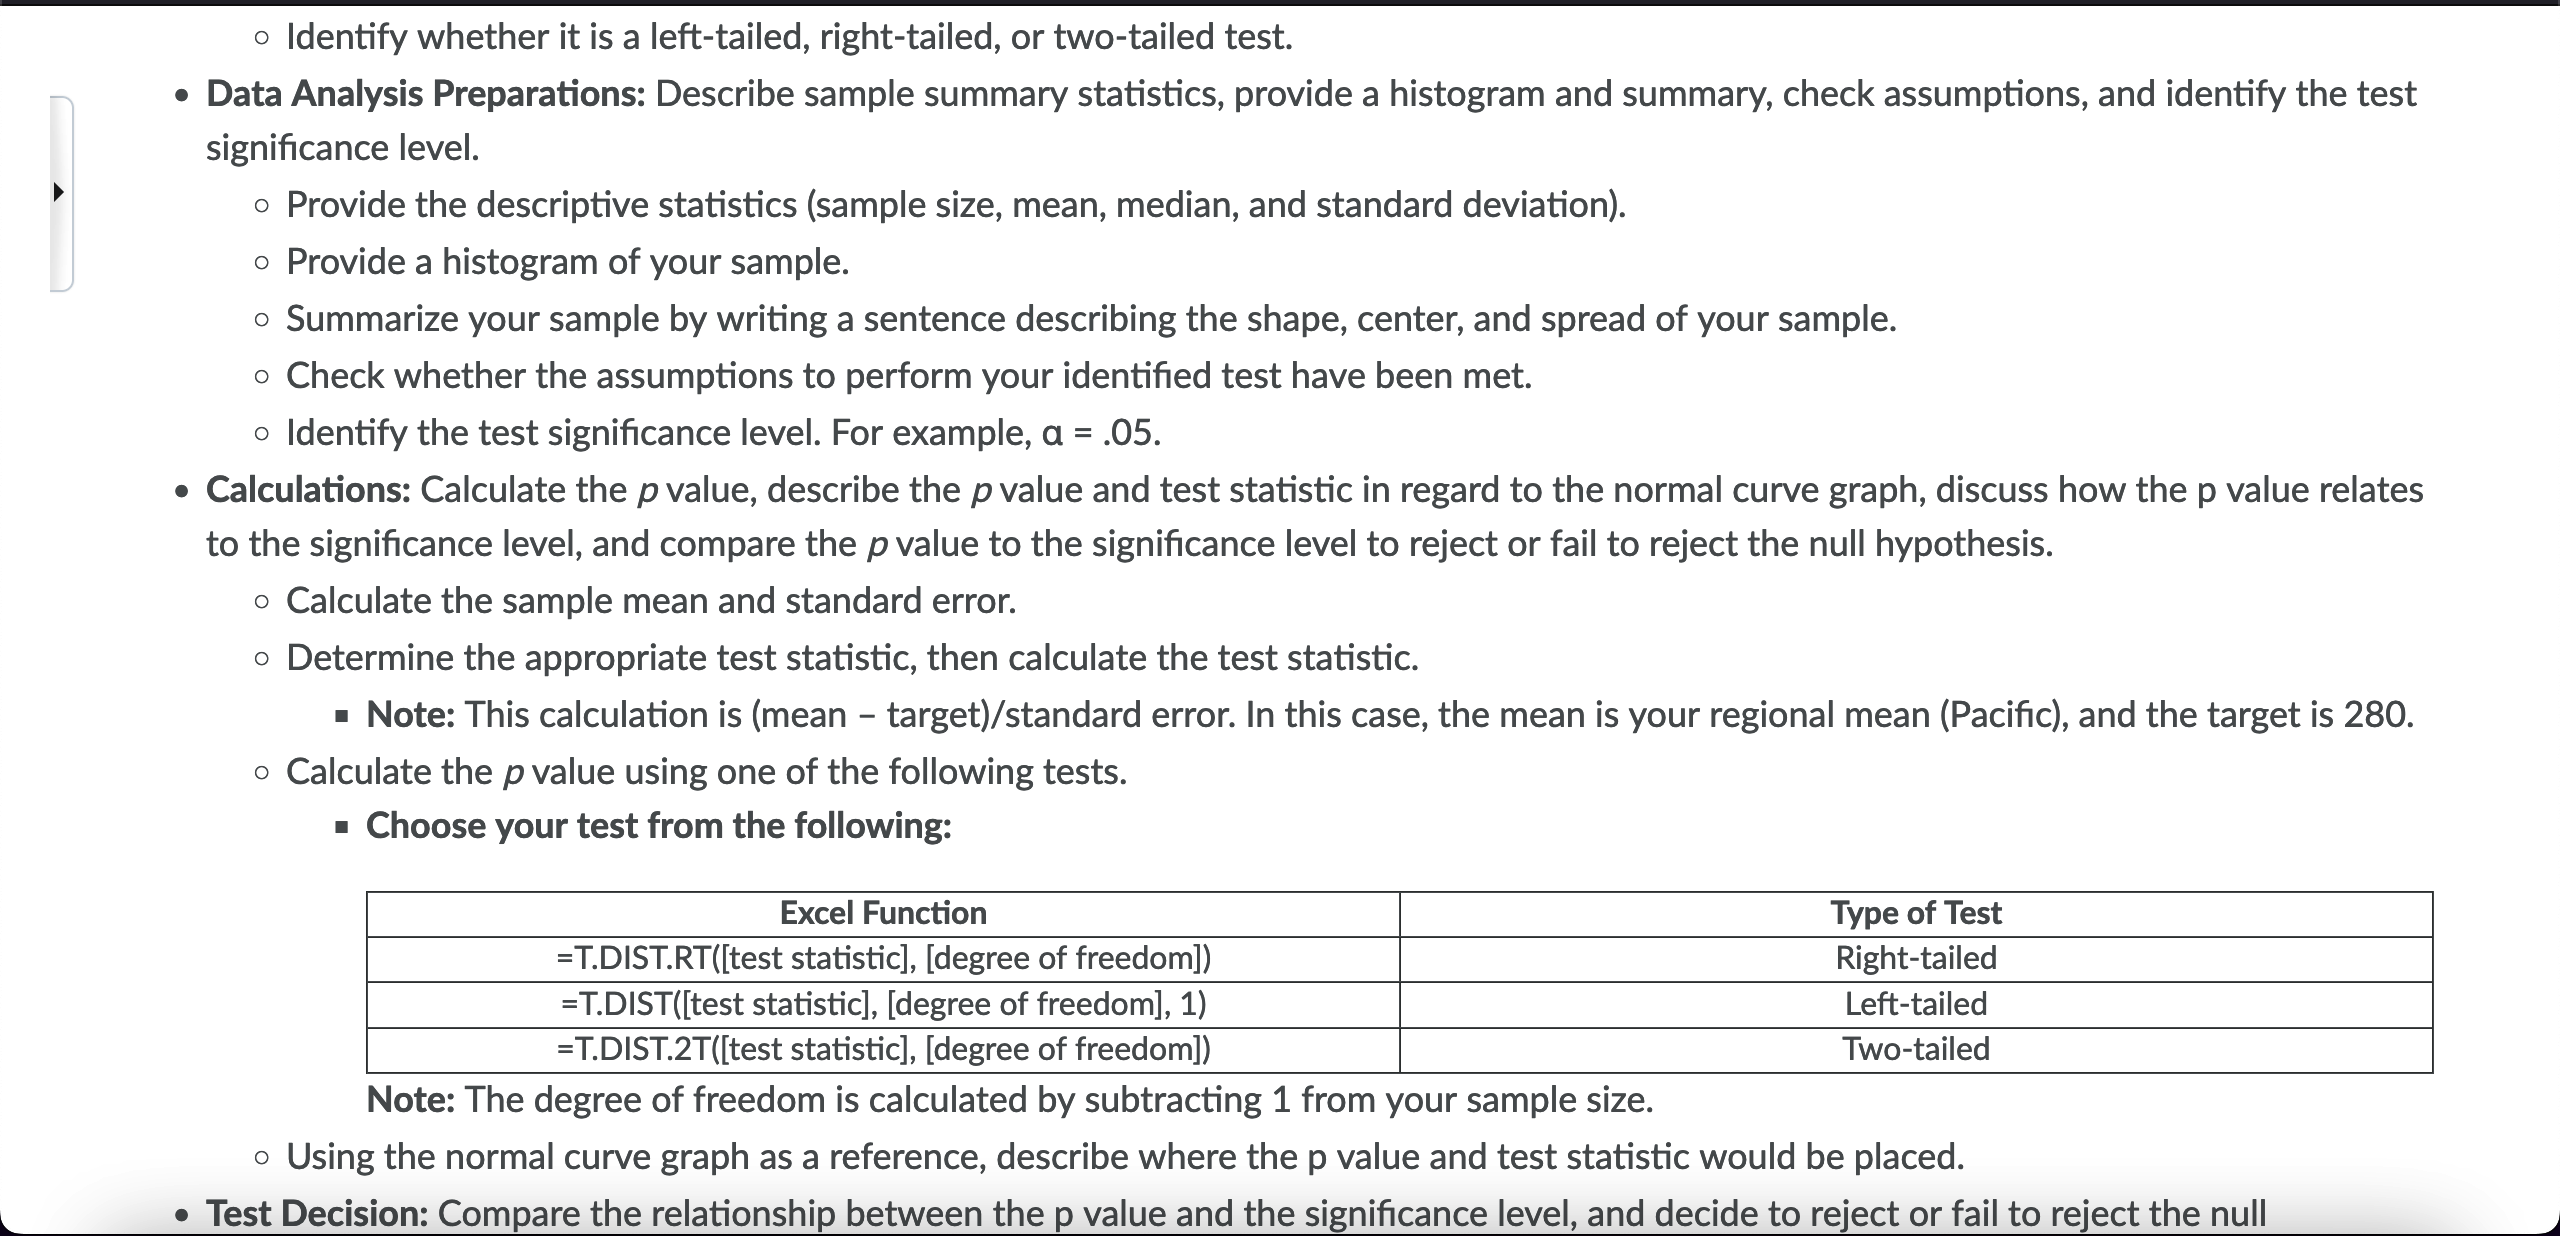
Test Decision: Compare the relationship between the p value and the significance level, and decide to reject or fail to reject the null hypothesis. Compare the relationship between the p value and significance level. Decide to reject or fail to reject the null hypothesis. Conclusion: Discuss how your test relates to the hypothesis and discuss the statistical significance. Explain in one paragraph how your test decision relates to your hypothesis and whether your conclusions are statistically significant. You can use the following tutorial that is specifically about this assignment: MAT-240 Module 5 Assignment Video Guidelines for Submission Submit the completed Module Five Assignment Template as a Word document that includes your response and supportive charts. Introduction [Describe the purpose of this analysis. Briefly describe how you generated your random sample of 750 houses.] [Define your population parameter.] Hypothesis Test Setup [Write the null and alternative hypotheses.] [Specify the name of the test you will use and identify whether it is a left-tailed, right-tailed, or two-tailed test.] Data Analysis Preparations [Provide the descriptive statistics of the sample (sample size, mean, median, and standard deviation).] [Provide a histogram of the sample.] [Summarize your sample by writing a sentence describing the shape, center, and spread of your sample.] [Check whether the assumptions to perform your identified test have been met.] [Identify the test significance level. For example, a = .05] Calculations [Calculate the sample mean and standard error.] [Determine the appropriate test statistic, then calculate the test statistic. Note: This calculation is (mean - target)/standard error. In this case, the mean is your regional mean (Pacific), and the target is 280.] [Calculate the p value using one of the following tests:] Hypothesis Testing for Regional Real Estate Company Excel Function Type of Test =T.DIST.RT([test statistic], [degree of freedom]) Right-tailed =T.DIST([test statistic], [degree of freedom], 1) Left-tailed =T.DIST.2T([test statistic], [degree of freedom]) Two-tailed [Note: The degree of freedom is calculated by subtracting 1 from your sample size.] [Use the normal curve graph as a reference to describe where the p value and test statistic would be placed.] Test Decision [Compare the relationship between the p value and significance level.] [Decide to reject or fail to reject the null hypothesis.] Conclusion [Explain in one paragraph how your test decision relates to your hypothesis and whether your 3 A B C D E F G H J K House list Cost pe Squar 1234 State County Region price square f footag Random AK matanuska-susi Pacific $270,000 $151 1,820 AK AK fairbanks north Pacific $222,750 $134 anchorage Pacific $315,050 $180 1,665 0.330689626 1,738 0.945018098 Sample mean target $263 280 1,786 5678202199=92222222222222222222227777744 33 36 AK 39 *******\ \ \ \ 5 5 5 5 5 5 5 AK matanuska-susi Pacific $269,420 $155 AK anchorage Pacific $344,050 $178 0.987963094 1,848 0.176339585 Standard error 5.806897003 test statistic AK anchorage Pacific $319,500 $179 1,754 AK fairbanks north Pacific $229,950 $138 1,667 0.766340785 0.994474332 degrees of freedom -$2.95 749 AK matanuska-susi Pacific $280,049 $159 1,850 0.157098597 AK matanuska-susi Pacific $290,000 $162 1,820 AK matanuska-susi Pacific $279,325 $155 0.21948056 1,872 0.699115413 AK anchorage Pacific $325,050 $180 1,775 AK matanuska-susi Pacific $284,500 $156 1,881 0.082259795 0.095188882 Left tailed test AK anchorage Pacific $345,550 $181 1,824 0.171502804 AK fairbanks north Pacific $199,050 $131 1,534 0.498557078 AK fairbanks north Pacific $224,950 $137 1,608 0.341196944 AK anchorage Pacific $339,050 $180 1,788 0.39211468 p value 0.001643787 AK matanuska-susi Pacific $299,050 $162 1,876 0.342032131 AK anchorage Pacific $342,500 $182 1,849 0.059048378 AK matanuska-susi Pacific $271,550 $153 1,792 0.515350784 right tailed test AK matanuska-susi Pacific $295,550 $161 1,860 0.615158934 AK fairbanks north Pacific $205,000 $133 1,540 0.332666432 AK fairbanks north Pacific $199,500 $132 1,545 0.340374628 AK fairbanks north Pacific $217,300 $137 1,600 0.734508283 p value 0.998356213 AK fairbanks north Pacific $233,050 $137 1,700 0.448867087 AK anchorage Pacific $325,050 $179 1,815 0.998449291 AK fairbanks north Pacific $218,500 $137 1,600 0.191422591 AK matanuska-susi Pacific $289,050 $162 1,840 0.659193192 AK matanuska-susi Pacific $285,050 $158 1,810 0.643794198 AK fairbanks north Pacific $207,000 $128 1,586 0.429496543 AK anchorage Pacific $300,049 $174 1,726 0.345154051 AK fairbanks north Pacific $200,722 $132 1,500 0.187002649 AK fairbanks north Pacific $223,193 $139 1,548 0.619220074 AK anchorage Pacific $334,007 $178 1,802 0.150391113 AK anchorage Pacific $315,050 $179 1,746 0.489953728 anchorage Pacific $319,000 $176 1,788 0.825692977 AK fairbanks north Pacific $219,950 $139 1,600 0.970989159 AK fairbanks north Pacific $222,450 $132 1,592 0.743708661 AK anchorage Pacific $329,500 $179 1,807 0.788038629 CA sacramento Pacific $394,391 $232 1,659 0.976495728 CA san mateo Pacific $1,301,950 $787 1,735 0.71976475 CA nevada Pacific $497,336 $248 2,271 0.120577197 CA CA CA alameda Pacific $799,050 $488 1,563 0.005072762 marin Pacific $1,314,050 $654 2,044 0.100107337 kings alameda Pacific Pacific $236,040 $134 1,659 0.837211648 $797.050 $185 1.605 0.051461917 A C D G House - Cost Squ 1 Sta Coul Reg pri square foot Random 2 AK matanuska-su Pacific $270,000 $151 1,820 AK fairbanks nor Pacific $222,750 $134 4 AK anchorage Pacific $315,050 $180 1,665 0.3306896 1,738 0.9450181 Sample mean $263 target 280 1,786 5 AK matanuska-su Pacific $269,420 6 AK anchorage Pacific $344,050 $155 $178 0.9879631 1848 0.1763396 Standard error test statistic 5.806897 7 AK anchorage Pacific $319,500 $179 1.754 0.7663408 degrees of freed on -$2.95 749 8 AK fairbanks nor Pacific $229,950 $138 1,667 0.9944743 9 AK matanuska-su Pacific $280,049 $159 AK matanuska-su Pacific $290,000 11 AK matanuska-su Pacific $279,325 $162 $155 1,850 0.1570986 1820 0.2194806 12 AK anchorage Pacific $325,050 $180 1,872 1,775 0.6991154 0.0822598 13 AK matanuska-su Pacific $284,500 $156 14 AK anchorage Pacific $345,550 $181 15 AK fairbanks nor Pacific $199,050 $131 16 AK fairbanks nor Pacific $224,950 $137 AK anchorage Pacific $339,050 $180 18 AK matanuska-su Pacific $299,050 $162 19 AK anchorage Pacific $342,500 $182 20 AK matanuska-su Pacific $271,550 $153 21 AK matanuska-su Pacific $295,550 $161 22 AK fairbanks nor Pacific $205,000 $133 23 AK fairbanks nor Pacific $199,500 $132 24 AK fairbanks nor Pacific $217,300 $137 25 AK fairbanks nor Pacific $233,050 $137 AK anchorage Pacific $325,050 $179 1881 0.0951889 1,824 0.1715028 1534 0.4985571 1,608 0.3411969 1,788 0.3921147 1876 0.3420321 1849 0.0590484 1,792 0.5153508 1860 0.6151589 1,540 0.3326664 1545 0.3403746 1,600 0.7345083 1,700 0.4488671 1815 0.9984493 Left tailed test p value 0.0016438 right tailed test p value 0.9983562 27 AK fairbanks nor Pacific $218,500 $137 1,600 0.1914226 28 AK matanuska-su Pacific $289,050 $162 1,840 0.6591932 29 AK matanuska-su Pacific $285,050 $158 1810 0.6437942 30 AK fairbanks nor Pacific $207,000 $128 1,586 0.4294965 31 AK anchorage Pacific $300,049 $174 1,726 0.3451541 32 AK fairbanks nor Pacific $200,722 $132 1,500 0.1870026 AK fairbanks nor Pacific $223,193 $139 34 AK anchorage Pacific $334,007 $178 AK anchorage Pacific $315,050 $179 1,548 0.6192201 1.802 0.1503911 1,746 0.4899537 36 AK anchorage Pacific $319,000 $176 37 AK fairbanks nor Pacific $219,950 $139 38 AK fairbanks nor Pacific $222,450 $132 39 AK anchorage Pacific $329,500 $179 1,788 0.825693 1.600 0.9709892 1,592 0.7437087 1,807 0.7880386 40 CA sacramento Pacific $394,391 $232 1,659 0.9764957 41 CA san mateo Pacific $1,301,950 $787 42 CA nevada Pacific $497,336 43 CA alameda Pacific $799,050 $248 $488 44 CA marin Pacific $1,314,050 $654 45 CA kings Pacific $236,040 $134 1,735 0.7197648 2,271 0.1205772 1,563 0.0050728 2,044 0.1001073 1.659 0.8372116 46 CA alamed a Pacific $797,050 $485 1,605 0.0514619 47 CA san diego Pacific $660,550 $377 1,761 0.6247015 48 CA Pacific $329,950 $176 1,874 0.3286452 CA kings Pacific $269,950 $152 1,786 0.8083883 50 CA el dorado Pacific 51 CA santa clara 52 CA fresno Pacific Pacific $544,550 $1,254,550 $269 2,050 0.3687517 $680 1,940 0.9165086 $325,050 $174 1,863 0.2574784 53 CA sacramento Pacific 54 CA lake Pacific 55 CA san diego 56 CA kern Pacific Pacific $389,500 $269,950 $675,000 $229 1.673 0.7683961 $172 $365 1,552 1853 $239,950 $129 1,616 CA 58 CA tuolumne Pacific ventura 59 CA san diego Pacific Pacific $342,550 $749,500 $198 1,767 $376 2,018 0.3838916 0.8876042 0.802983 0.1809691 0.6446452 $717,500 $405 1,800 0.9080352 60 CA lake Pacific $279,950 $181 1,577 0.4345749 61 CA el dorado Pacific 62 CA madera Pacific 63 CA marin Pacific 64 CA merced Pacific 65 CA butte Pacific $534,050 $335,050 $1,383,550 $636 $300,661 $304,050 $260 2.089 0.6481951 $168 66 CA mendocino Pacific 67 CA contra costa Pacific 68 CA santa clara Pacific 69 CA shasta Pacific 70 CA san mateo Pacific 71 CA kines Pacific 72 CA tulare Pacific $175 $186 $629,950 $305 $699,050 $403 $1,164,957 $720 $336,550 $190 $1,595,050 $899 $262,479 $149 $250,050 $136 1,956 2,151 1,752 0.9118739 0.4123105 0.0304418 1,646 0.1099355 1.500 0.9780196 2,022 0.5449679 1,670 0.1377388 1,809 0.9151867 1,820 0.9497463 1,758 0.6762297 1,795 0.6083946 N 0 P R S T U V X Z AA Sqare feet [$104, $165] ($165, $226] ($226, $287] ($287, $348) ($348, $409) ($409, $470) ($470, $531] ($531, $592) ($592, $653) ($653, $714) ($714, $775) ($775, $836) ($836, $897) ($897, $958) ($958, $1,019) Scenario You have been hired by the Regional Real Estate Company to help them analyze real estate data. One of the company's Pacific region salespeople just returned to the office with a newly designed advertisement. The average cost per square foot of home sales based on this advertisement is $280. The salesperson claims that the average cost per square foot in the Pacific region is less than $280. In other words, he claims that the newly designed advertisement would result in higher average cost per square foot in the Pacific Region. He wants you to make sure he can make that statement before approving the use of the advertisement. In order to test his claim, you will generate a random sample of size 750 houses using data for the Pacific region and use this data to perform a hypothesis test. Prompt Generate a sample of size 750 houses using data for the Pacific region. Then, design a hypothesis test and interpret the results using significance level a = .05. You will work with this sample in this assignment. Briefly describe how you generated your random sample. Use the House Listing Price by Region document to help support your work on this assignment. You may also use the Descriptive Statistics in Excel PDF and Creating Histograms in Excel PDF tutorials for support. Specifically, you must address the following rubric criteria, using the Module Five Assignment Template Word Document Introduction: Describe the purpose of this analysis and how you generated your random sample size of 750 houses. Hypothesis Test Setup: Define your population parameter, including hypothesis statements, and specify the appropriate test. Define your population parameter. Write the null and alternative hypotheses. Specify the name of the test you will use. Identify whether it is a left-tailed, right-tailed, or two-tailed test. Data Analysis Preparations: Describe sample summary statistics, provide a histogram and summary, check assumptions, and identify the test significance level. Provide the descriptive statistics (sample size, mean, median, and standard deviation). Provide a histogram of your sample. Summarize your sample by writing a sentence describing the shape, center, and spread of your sample. Check whether the assumptions to perform your identified test have been met. Identify the test significance level. For example, a = .05. Calculations: Calculate the p value, describe the p value and test statistic in regard to the normal curve graph, discuss how the p value relates to the significance level, and compare the p value to the significance level to reject or fail to reject the null hypothesis. Calculate the sample mean and standard error. Determine the appropriate test statistic, then calculate the test statistic. Note: This calculation is (mean - target)/standard error. In this case, the mean is your regional mean (Pacific), and the target is 280. Calculate the p value using one of the following tests. Choose your test from the following: Excel Function =T.DIST.RT([test statistic], [degree of freedom]) =T.DIST([test statistic], [degree of freedom], 1) =T.DIST.2T([test statistic], [degree of freedom]) Note: The degree of freedom is calculated by subtracting 1 from your sample size. Type of Test Right-tailed Left-tailed Two-tailed Using the normal curve graph as a reference, describe where the p value and test statistic would be placed. Test Decision: Compare the relationship between the p value and the significance level, and decide to reject or fail to reject the null
Step by Step Solution
There are 3 Steps involved in it

Get step-by-step solutions from verified subject matter experts