

Question: = Test: Math 1342:... Test: Math 1342:... Question 17 This Test: 36 pts possible Submit Test Volumes of soda (oz) The data table to the
= Test: Math 1342:...
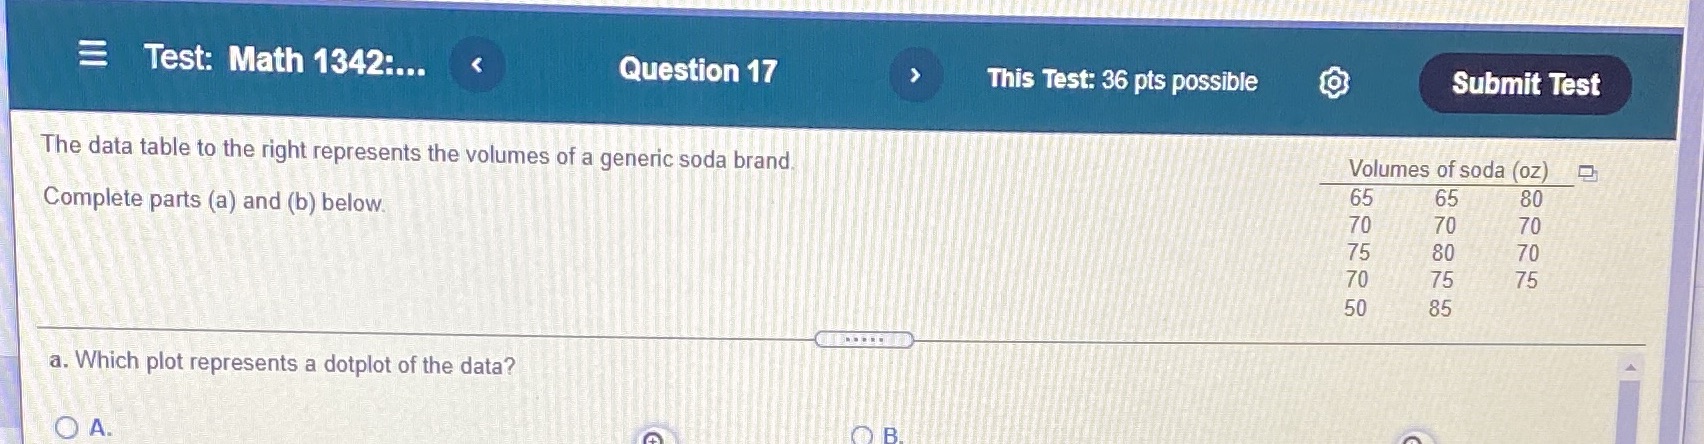
Test: Math 1342:... Question 17 This Test: 36 pts possible Submit Test Volumes of soda (oz) The data table to the right represents the volumes of a generic soda brand. Complete parts (a) and (b) below. a. Which plot represents a dotplot of the data? 65 70 75 70 50 65 70 80 75 85 80 70 70 75
Step by Step Solution
There are 3 Steps involved in it
1 Expert Approved Answer
Step: 1 Unlock

Question Has Been Solved by an Expert!
Get step-by-step solutions from verified subject matter experts
Step: 2 Unlock
Step: 3 Unlock