

Question: A certain counselor wants to compare mean IQ scores for two different social groups. A random sample of 15 tQ scores from group 1
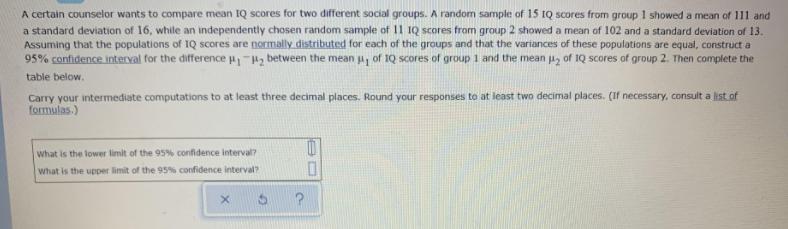
A certain counselor wants to compare mean IQ scores for two different social groups. A random sample of 15 tQ scores from group 1 showed a mean of 111 and a standard deviation of 16, while an independently chosen random sample of 11 1Q scores from group 2 showed a mean of 102 and a standard deviation of 13. Assuming that the populations of 1Q scores are normally distributed for each of the groups and that the variances of these populations are equal, construct a 95% contidence interval for the difference p between the mean u, of 1Q scores of group 1 and the mean u, of 1Q scores of group 2. Then complete the table below. Carry your intermediate computations to at least three decimal places. Round your responses to at least two decimal places. (If necessary, consult a list of formulas.) what is the lower limit of the 95% conidence interval? What is the upper limit of the 95% confidence interval?
Step by Step Solution
3.27 Rating (147 Votes )
There are 3 Steps involved in it

Get step-by-step solutions from verified subject matter experts