

Question: Test scores for a college statistics class held during the day are: 99; 56; 78; 55.5; 32; 90; 80; 81; 56; 59; 45; 77;
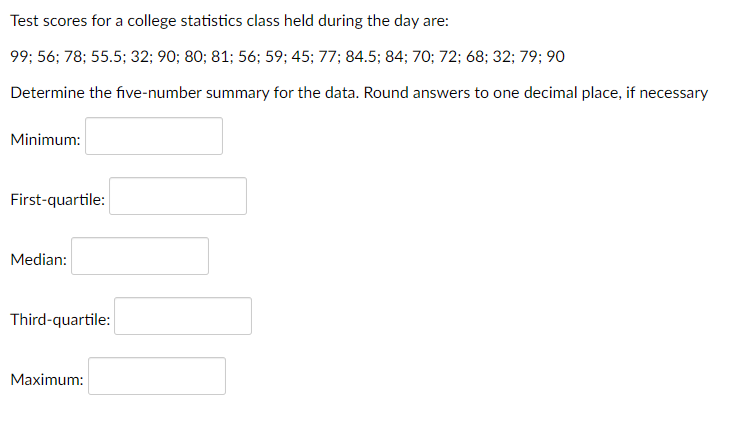
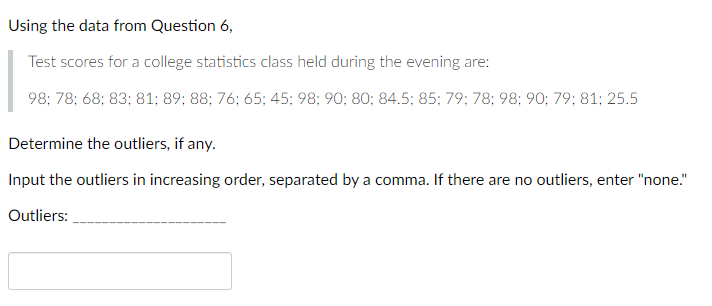
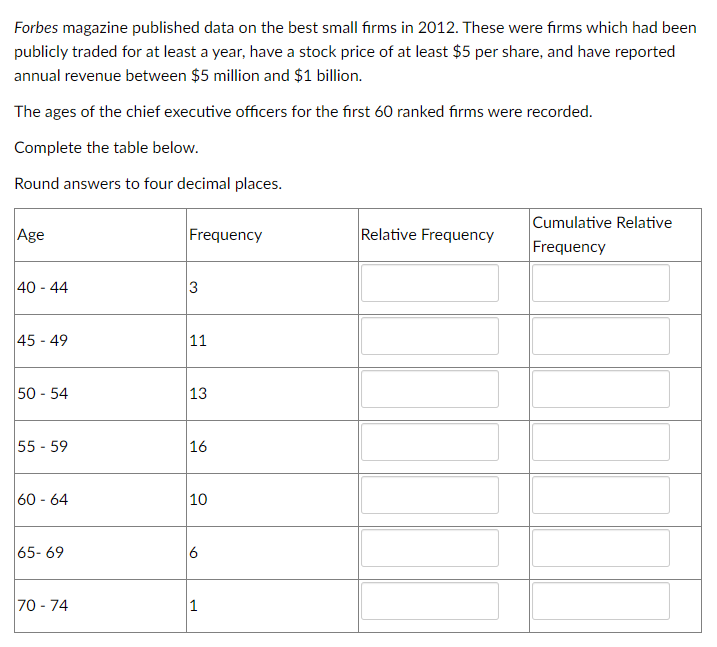
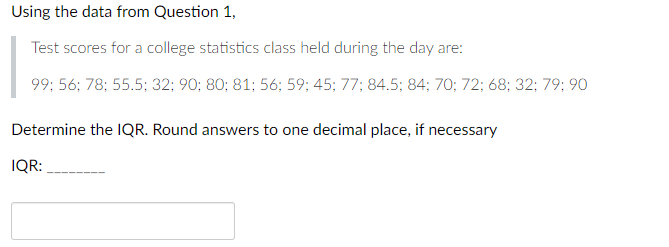
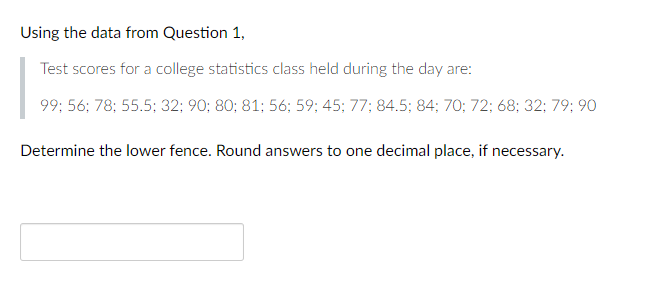
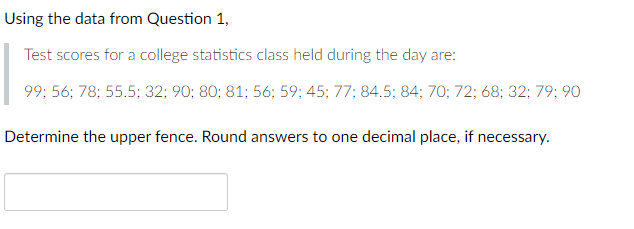
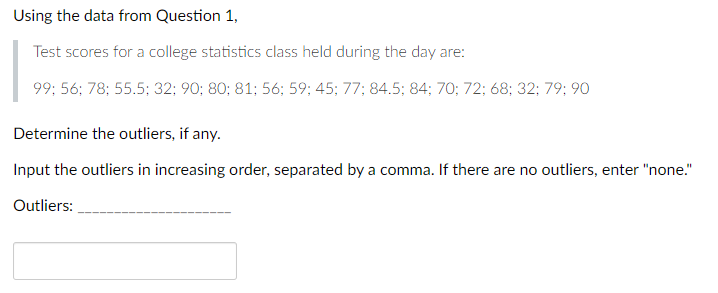
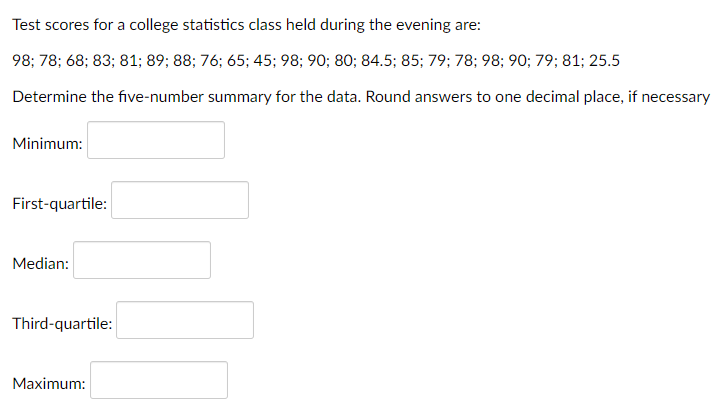
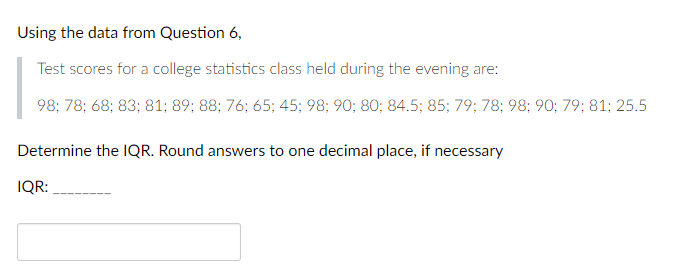
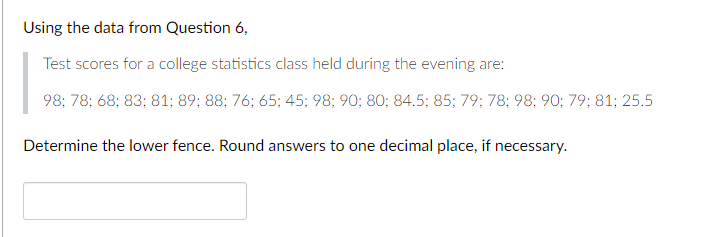
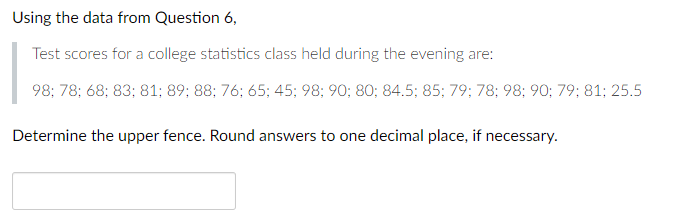
Test scores for a college statistics class held during the day are: 99; 56; 78; 55.5; 32; 90; 80; 81; 56; 59; 45; 77; 84.5; 84; 70; 72; 68; 32; 79; 90 Determine the five-number summary for the data. Round answers to one decimal place, if necessary Minimum: First-quartile: Median: Third-quartile: Maximum: Using the data from Question 6, Test scores for a college statistics class held during the evening are: 98; 78: 68; 83; 81; 89; 88; 76: 65; 45; 98; 90; 80; 84.5; 85; 79; 78; 98; 90; 79; 81; 25.5 Determine the outliers, if any. Input the outliers in increasing order, separated by a comma. If there are no outliers, enter "none." Outliers: Forbes magazine published data on the best small firms in 2012. These were firms which had been publicly traded for at least a year, have a stock price of at least $5 per share, and have reported annual revenue between $5 million and $1 billion. The ages of the chief executive officers for the first 60 ranked firms were recorded. Complete the table below. Round answers to four decimal places. Age Frequency 40-44 3 45-49 11 50-54 13 55-59 16 60-64 10 65-69 6 70-74 1 Cumulative Relative Relative Frequency Frequency Using the data from Question 1, Test scores for a college statistics class held during the day are: 99; 56: 78; 55.5; 32; 90; 80; 81; 56; 59; 45; 77; 84.5; 84; 70; 72; 68; 32; 79; 90 Determine the IQR. Round answers to one decimal place, if necessary IQR: Using the data from Question 1, Test scores for a college statistics class held during the day are: 99; 56; 78; 55.5; 32; 90; 80; 81; 56; 59; 45; 77; 84.5; 84; 70; 72; 68; 32; 79; 90 Determine the lower fence. Round answers to one decimal place, if necessary. Using the data from Question 1, Test scores for a college statistics class held during the day are: 99; 56; 78; 55.5; 32; 90; 80; 81; 56; 59; 45; 77; 84.5; 84; 70; 72; 68; 32; 79; 90 Determine the upper fence. Round answers to one decimal place, if necessary. Using the data from Question 1, Test scores for a college statistics class held during the day are: 99; 56; 78; 55.5; 32; 90; 80; 81; 56; 59; 45; 77; 84.5; 84; 70; 72; 68; 32; 79; 90 Determine the outliers, if any. Input the outliers in increasing order, separated by a comma. If there are no outliers, enter "none." Outliers: Test scores for a college statistics class held during the evening are: 98; 78; 68; 83; 81; 89; 88; 76; 65; 45; 98; 90; 80; 84.5; 85; 79; 78; 98; 90; 79; 81; 25.5 Determine the five-number summary for the data. Round answers to one decimal place, if necessary Minimum: First-quartile: Median: Third-quartile: Maximum: Using the data from Question 6, Test scores for a college statistics class held during the evening are: 98; 78: 68; 83; 81; 89; 88; 76; 65; 45; 98; 90; 80; 84.5; 85; 79; 78; 98; 90; 79; 81; 25.5 Determine the IQR. Round answers to one decimal place, if necessary IQR: Using the data from Question 6, Test scores for a college statistics class held during the evening are: 98; 78; 68; 83; 81; 89; 88; 76; 65; 45; 98; 90; 80; 84.5; 85; 79; 78; 98; 90; 79; 81; 25.5 Determine the lower fence. Round answers to one decimal place, if necessary. Using the data from Question 6, Test scores for a college statistics class held during the evening are: 98; 78: 68; 83; 81; 89; 88; 76; 65; 45; 98; 90; 80; 84.5; 85; 79; 78; 98; 90; 79; 81; 25.5 Determine the upper fence. Round answers to one decimal place, if necessary.
Step by Step Solution
There are 3 Steps involved in it

Get step-by-step solutions from verified subject matter experts