

Question: test statistics and p values A statistics professor claims that the average soore on the Final Exam was 34. A group of students believes that
test statistics and p values
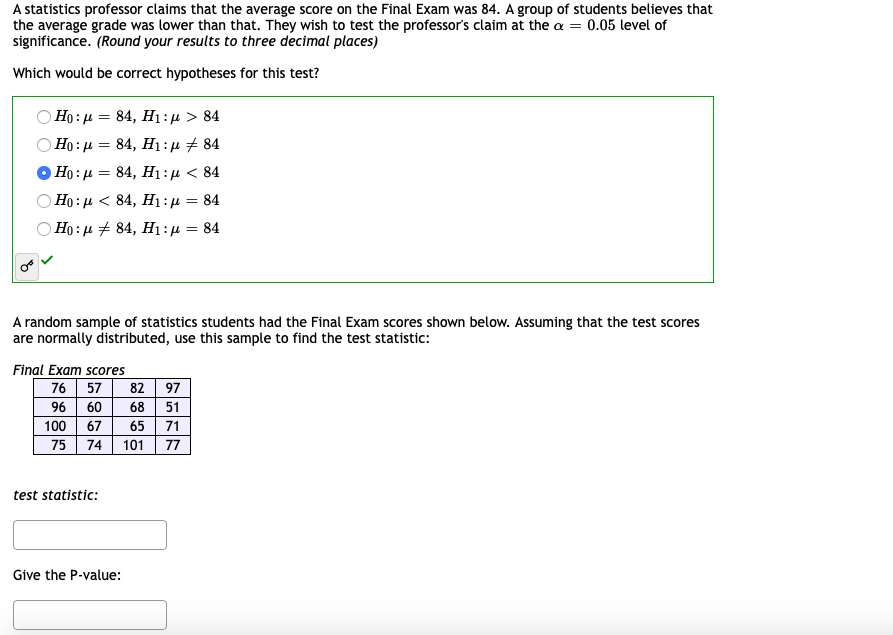
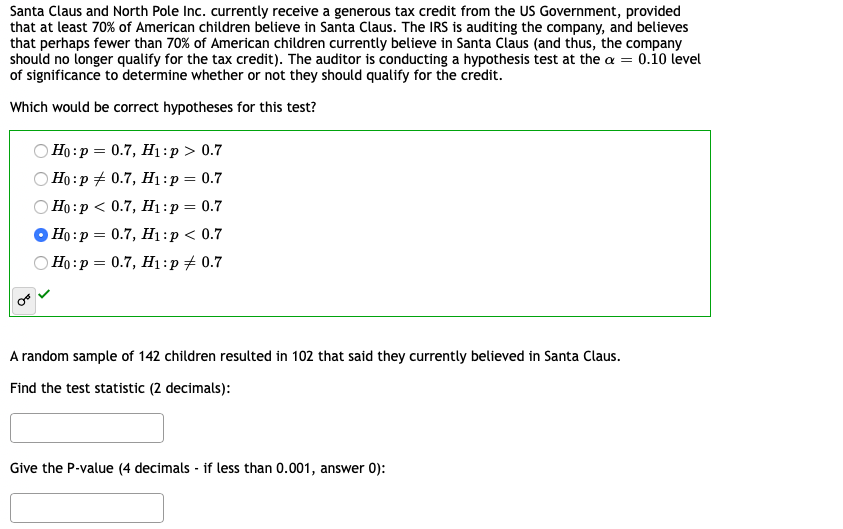
A statistics professor claims that the average soore on the Final Exam was 34. A group of students believes that the average grade was lower than that. They wish to test the professor's claim at the a = 0.05 level of significance. (Round your results to three decimal places} which would be correct hypotheses for this test? A random sample of statistics students had the Final Exam scores shown below. Assuming that the test scores are normally distributed, use this sample to find the test statistic: test statistic: Give the P-value: l Santa Claus and North Pole Inc. currently receive a generous tax credit from the US Government, provided that at least 70% of American children believe in Santa Claus. The IRS is auditing the company, and believes that perhaps fewer than 70% of American children currently believe in Santa Claus (and thus, the company should no longer qualify for the tax credit). The auditor is conducting a hypothesis test at the or = 0.10 level of significance to determine whether or not they should qualify for the credit. Which would be correct hypotheses for this test? OHo:p = 0.7, H1:p > 0.7 O Ho:p # 0.7, H1 :p = 0.7 OHo:p
Step by Step Solution
There are 3 Steps involved in it

Get step-by-step solutions from verified subject matter experts