

Question: Test: Take Home Exam 2 This Question: 1 pt Use the figure for the question(s) below. Consider the following graph of the security market
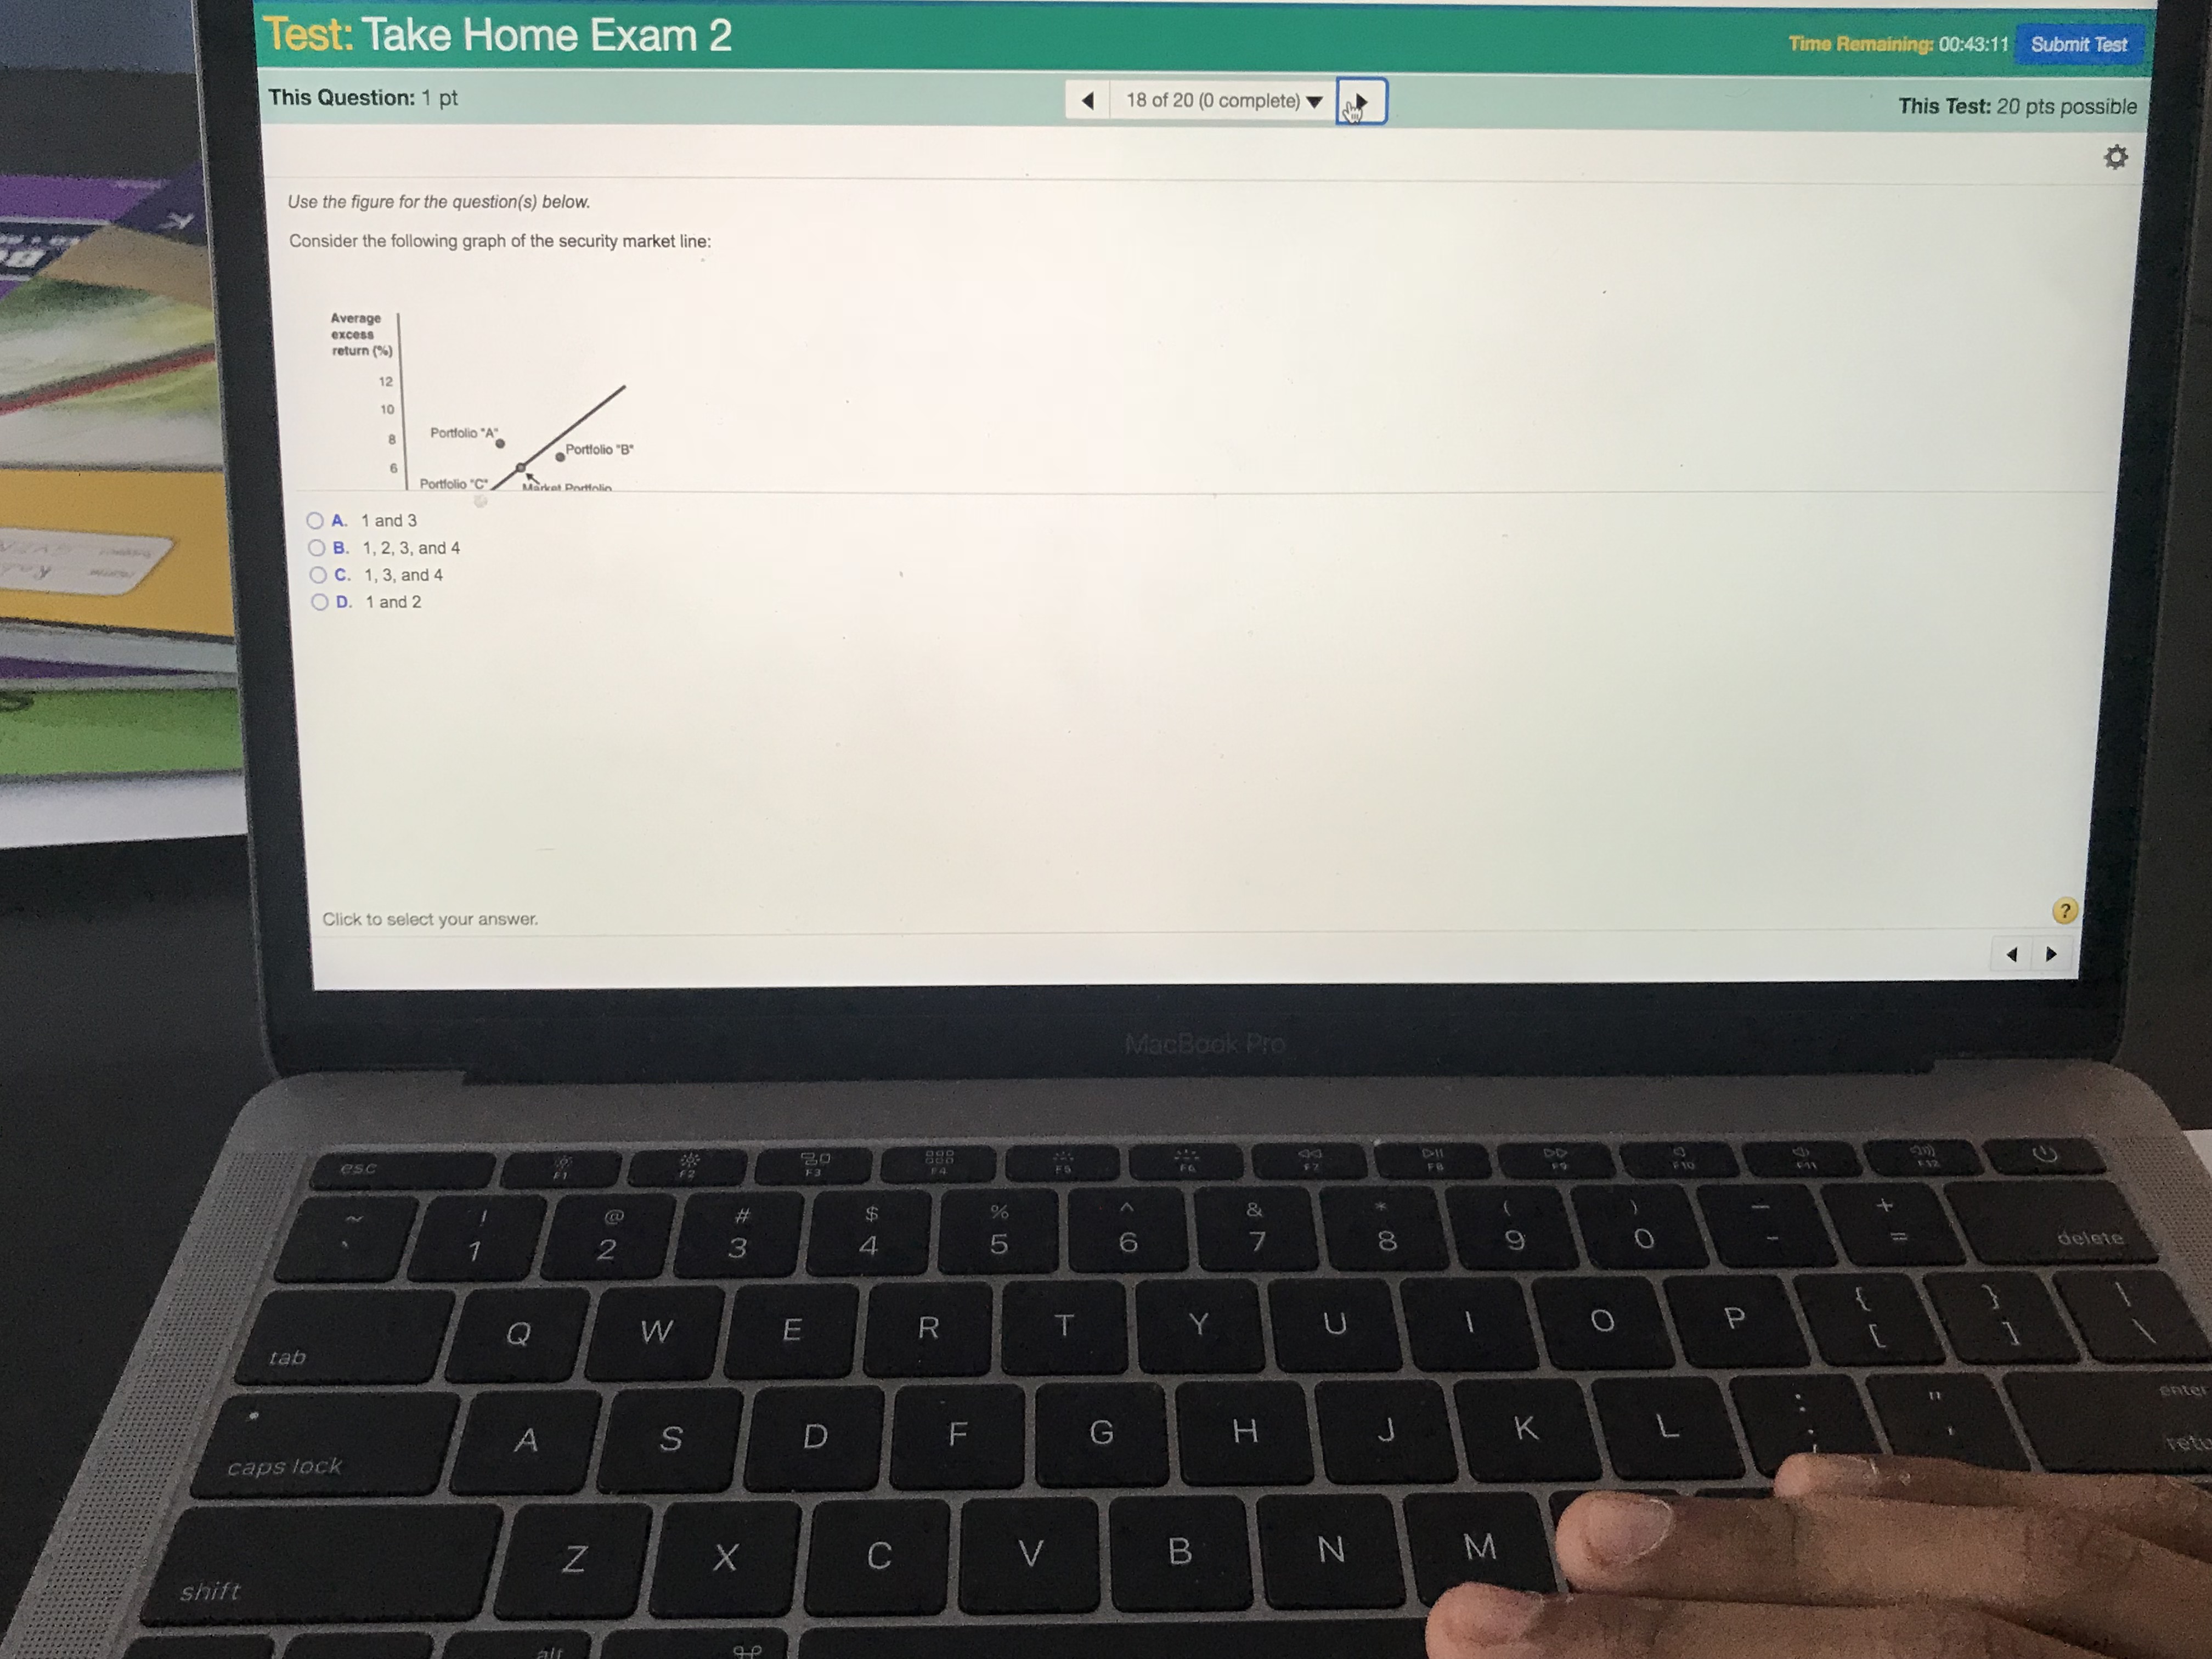

Test: Take Home Exam 2 This Question: 1 pt Use the figure for the question(s) below. Consider the following graph of the security market line: Average excess return (%) 12 10 Portfolio "A" 8 Portfolio "B 6 Portfolio "C" Market Portfolio A. 1 and 3 B. 1, 2, 3, and 4 C. 1, 3, and 4 D. 1 and 2 Click to select your answer. tab esc caps lock shift 7 Q A @2 W S N Alf #3 X 20 F3 $ 694 000 8880 FA Time Remaining: 00:43:11 Submit Test 18 of 20 (0 complete) This Test: 20 pts possible MacBook Pro % & 5 6 7 44 F7 E R T Y U D LL * 00 4 FB F10 32 9 0 0 { P G H J K L C V B N M [ ? delete enter rete
Step by Step Solution
There are 3 Steps involved in it

Get step-by-step solutions from verified subject matter experts