

Question: Test: Test 1 (Ch1 & Ch2) Employee Salaries 300- Use the frequency histogram to complete the following parts (a) Determine the number of classes. (b)
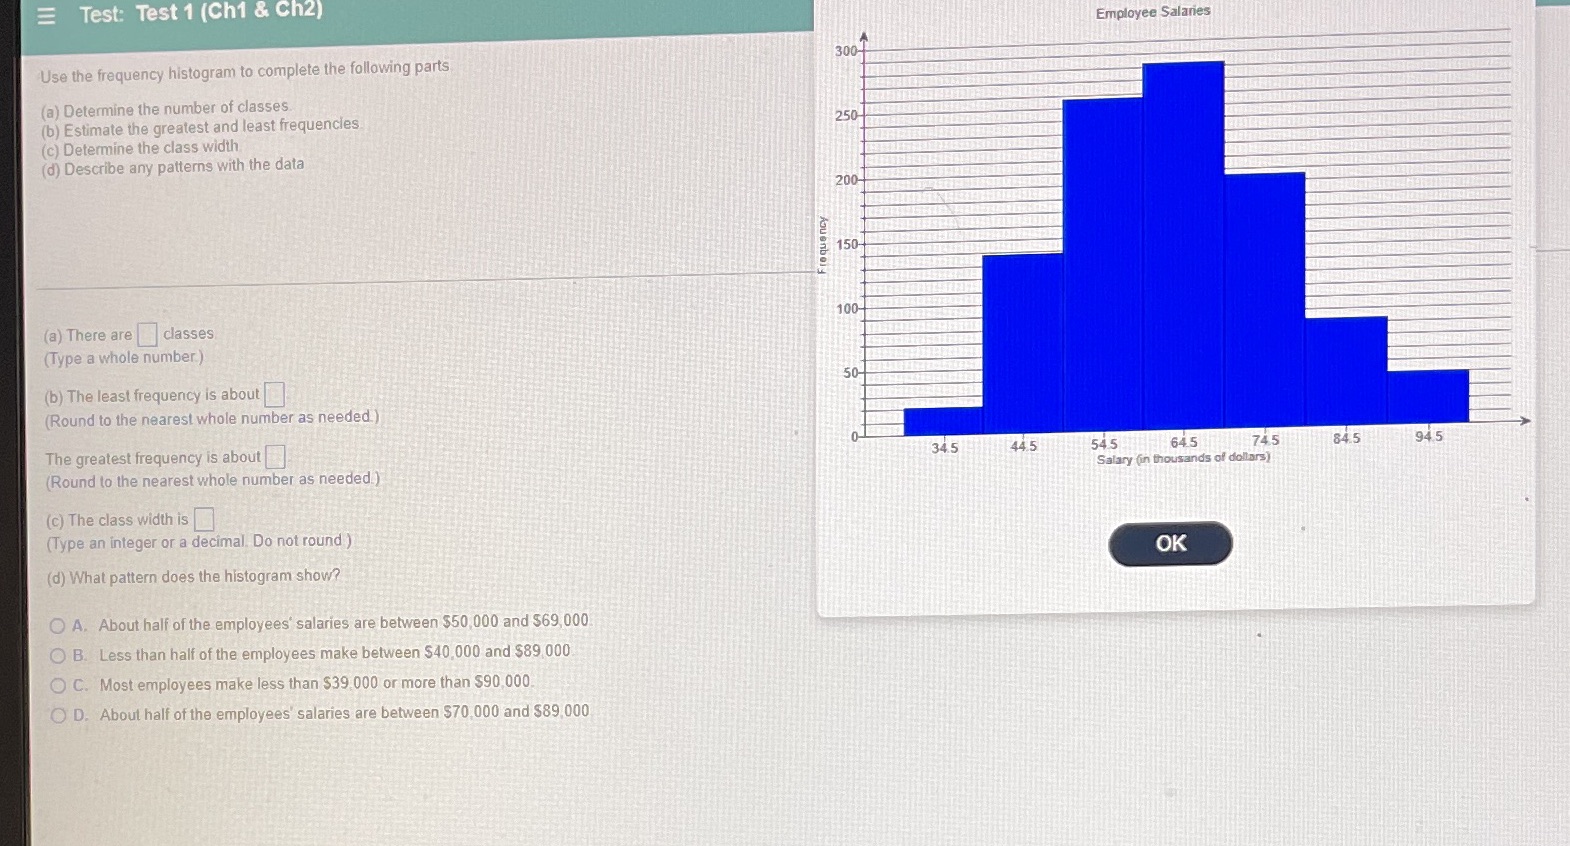
Test: Test 1 (Ch1 & Ch2) Employee Salaries 300- Use the frequency histogram to complete the following parts (a) Determine the number of classes. (b) Estimate the greatest and least frequencies. 250 (c) Determine the class width (d) Describe any patterns with the data 200- Frequency 150- 100- (a) There are |classes (Type a whole number) (b) The least frequency is about 50- (Round to the nearest whole number as needed.) The greatest frequency is about 34.5 44 5 545 645 745 845 945 (Round to the nearest whole number as needed.) Salary (in thousands of dollars) (c) The class width is (Type an integer or a decimal. Do not round ) OK (d) What pattern does the histogram show? O A. About half of the employees' salaries are between $50,000 and $69,000 O B. Less than half of the employees make between $40,000 and $89,000 O C. Most employees make less than $39.000 or more than $90,000 O D. About half of the employees' salaries are between $70,000 and $89,000
Step by Step Solution
There are 3 Steps involved in it

Get step-by-step solutions from verified subject matter experts