

Question: Test the given claim. Identify the null hypothesis, alternative hypothesis, test statistic, P-value, and then state the conclusion about the null hypothesis, as well
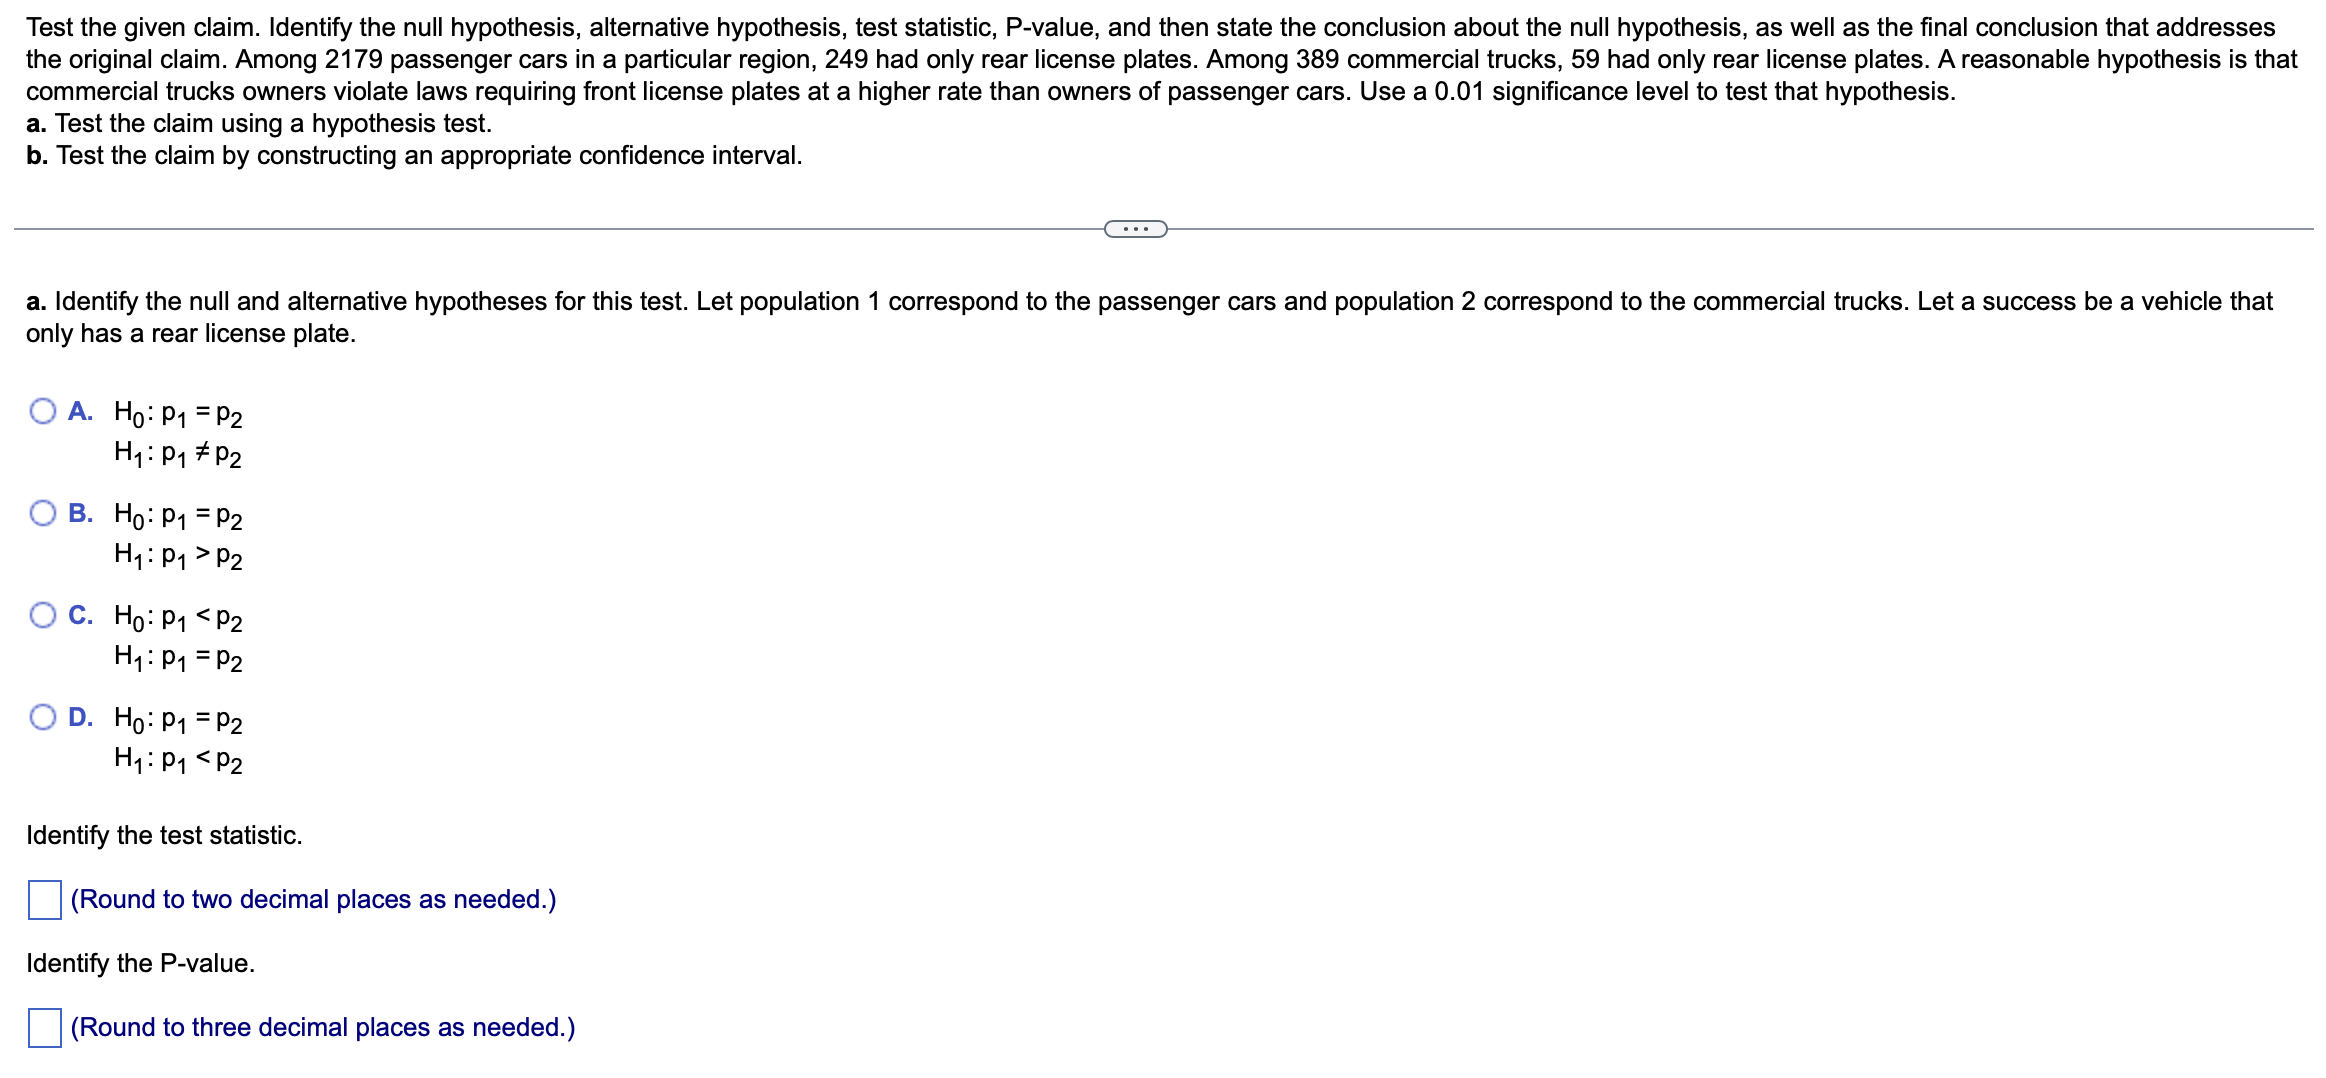
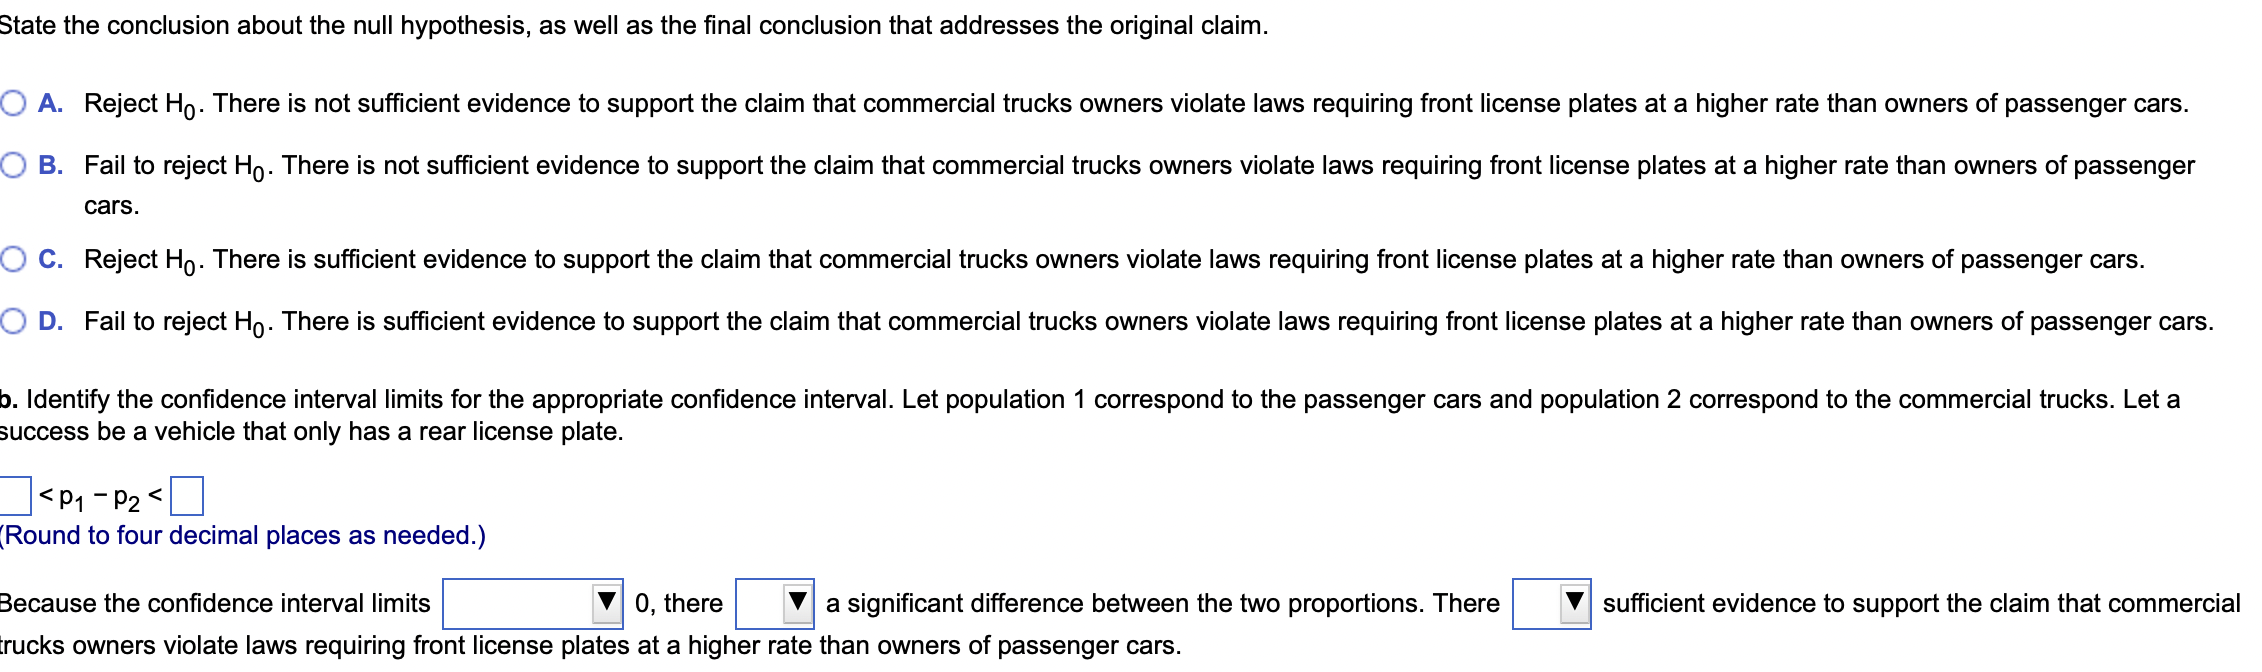
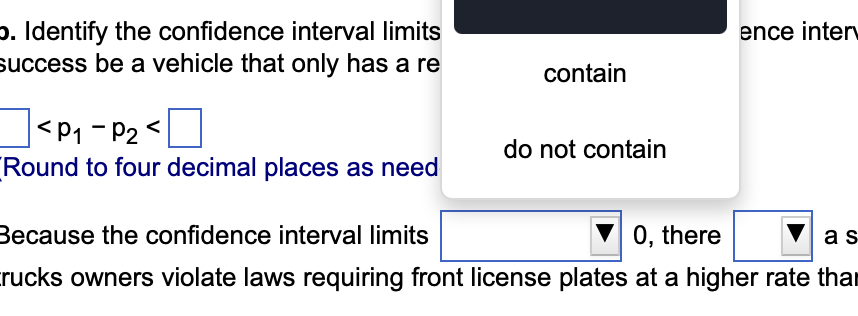
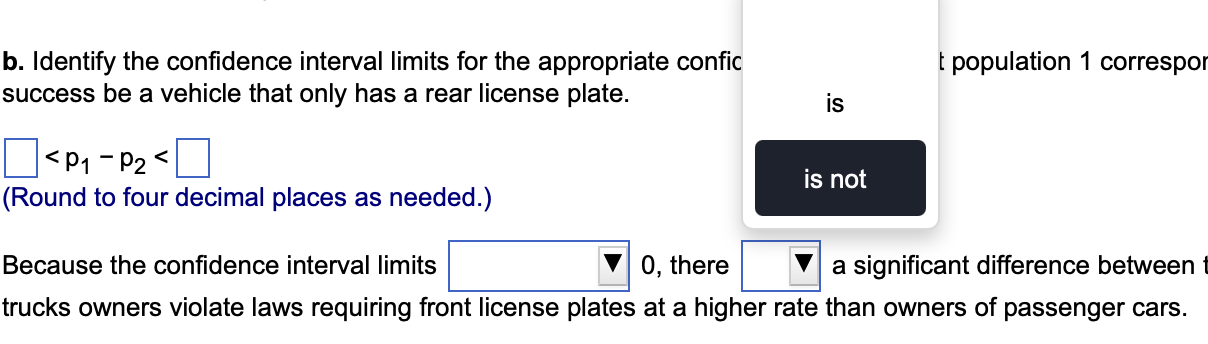
Test the given claim. Identify the null hypothesis, alternative hypothesis, test statistic, P-value, and then state the conclusion about the null hypothesis, as well as the final conclusion that addresses the original claim. Among 2179 passenger cars in a particular region, 249 had only rear license plates. Among 389 commercial trucks, 59 had only rear license plates. A reasonable hypothesis is that commercial trucks owners violate laws requiring front license plates at a higher rate than owners of passenger cars. Use a 0.01 significance level to test that hypothesis. a. Test the claim using a hypothesis test. b. Test the claim by constructing an appropriate confidence interval. a. Identify the null and alternative hypotheses for this test. Let population 1 correspond to the passenger cars and population 2 correspond to the commercial trucks. Let a success be a vehicle that only has a rear license plate. OA. Ho P1 P2 H: P1 P2 B. Ho: P1 P2 H: P1 P2 OC. Ho: P1 P2 H: P1 P2 OD. Ho P1 P2 H: P1 P2 Identify the test statistic. (Round to two decimal places as needed.) Identify the P-value. (Round to three decimal places as needed.) State the conclusion about the null hypothesis, as well as the final conclusion that addresses the original claim. A. Reject Ho. There is not sufficient evidence to support the claim that commercial trucks owners violate laws requiring front license plates at a higher rate than owners of passenger cars. B. Fail to reject Ho. There is not sufficient evidence to support the claim that commercial trucks owners violate laws requiring front license plates at a higher rate than owners of passenger cars. C. Reject Ho. There is sufficient evidence to support the claim that commercial trucks owners violate laws requiring front license plates at a higher rate than owners of passenger cars. D. Fail to reject Ho. There is sufficient evidence to support the claim that commercial trucks owners violate laws requiring front license plates at a higher rate than owners of passenger cars. b. Identify the confidence interval limits for the appropriate confidence interval. Let population 1 correspond to the passenger cars and population 2 correspond to the commercial trucks. Let a success be a vehicle that only has a rear license plate. . Identify the confidence interval limits success be a vehicle that only has a re b. Identify the confidence interval limits for the appropriate confic success be a vehicle that only has a rear license plate. I to the passenger cars ar is e two proportions. There is not orrespond to the commercial trucks. Let a sufficient evidence to support the claim that comm
Step by Step Solution
There are 3 Steps involved in it

Get step-by-step solutions from verified subject matter experts