

Question: Test Two QM456 (if you use a rolling r chart, use an n of 3) Going to the Dogs Inc. (100,000 employees) decided they should
Test Two QM456 (if you use a rolling r chart, use an n of 3)
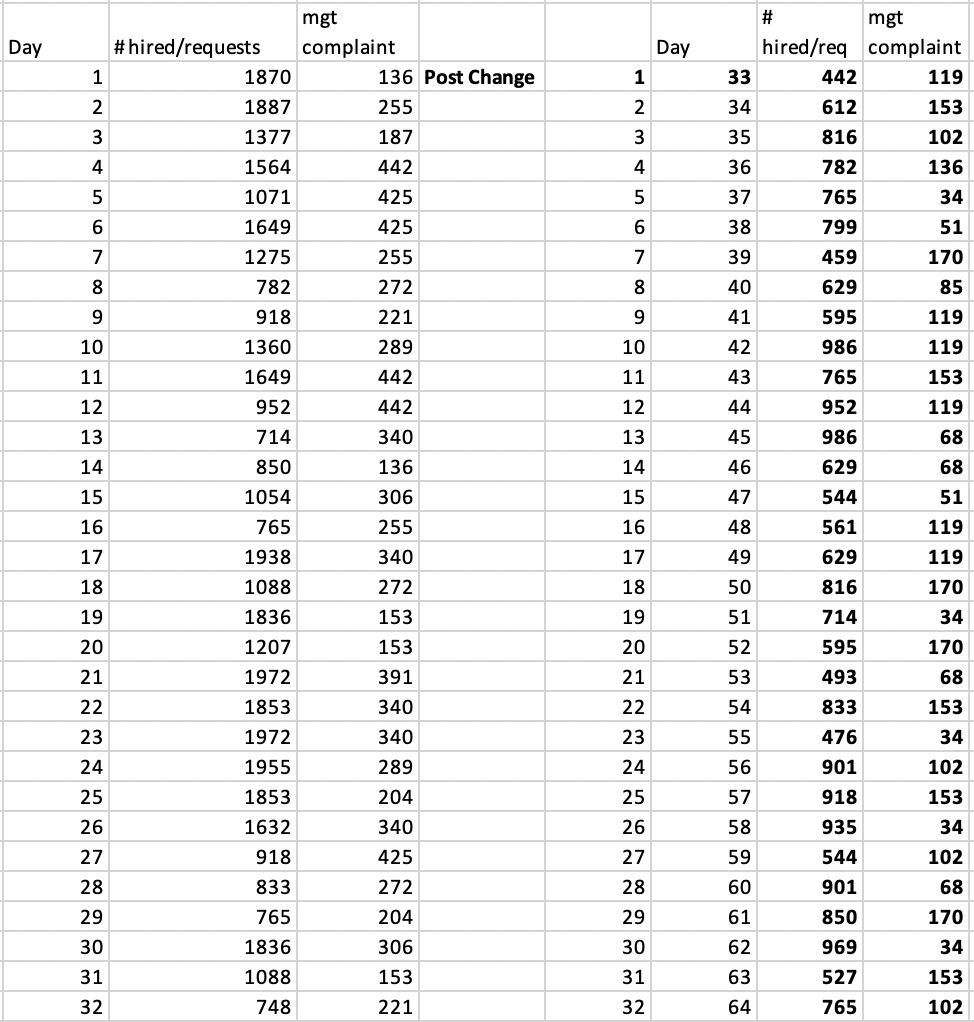
Going to the Dogs Inc. (100,000 employees) decided they should do something about their hiring process. Management had finally decided that turnover was too high, costing them lots of training costs, lost production, and low quality production. The Hired and complaints per day data set shows pre and post data relevant to the process pre and post hiring process change/process treatment. Each complaint indicates how many people hired did not fit the position they were hired for. In all data sets, the first 30 data points are pretreatment. The second set of 30 data points for all tabs are from after the process treatment. The first set of data has 32 points of data pre and post process change, the others are 30.
The first step in their process improvement project was to get a clear picture of their company relative to the total quality framework to determine what was constraining their hiring process from an organizational standpoint. This research also informed them as to if the turnover could be attributed to their hiring process and/or to their general organizational structure and resulting policies and procedures. They decided it was some of both.
Definition of the correct product.
The second step was to determine what their hiring process should be able to accomplish. They decided that the correct product of this process was placement of a person that was willing and able to accomplish the task, duties, and responsibilities (TDRs) of the job. This placement would occur within 15 days of the hiring request and would be accomplished for under $1000 per hire.
The production process that they determined would work consisted of the following process steps.
Manager request for a new hire
Request and TDRs placed in appropriate distribution channels where perspective job candidates would easily find them (advertising)
Screening all applicants to create a set of prospective employees to interview
Interview process
Selection and job offer
The first set of data shows how many people hired per day and how many of them did not fit the position.
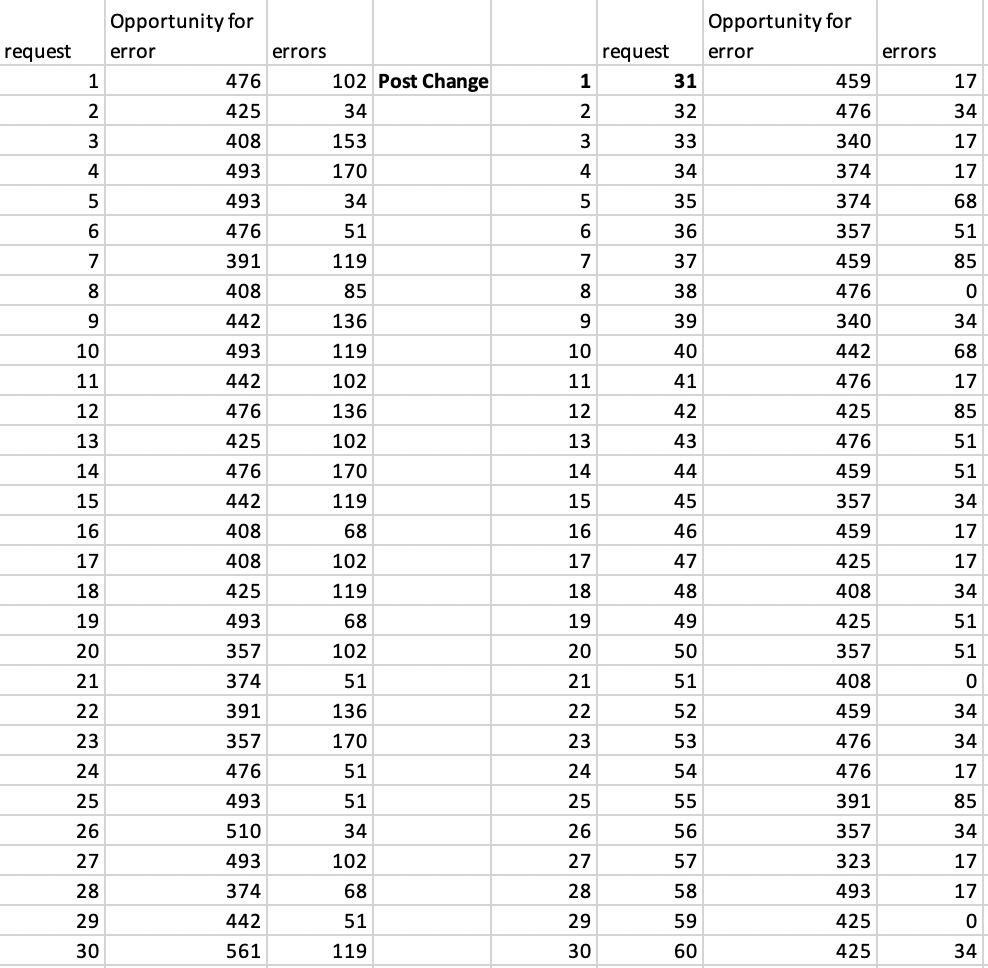
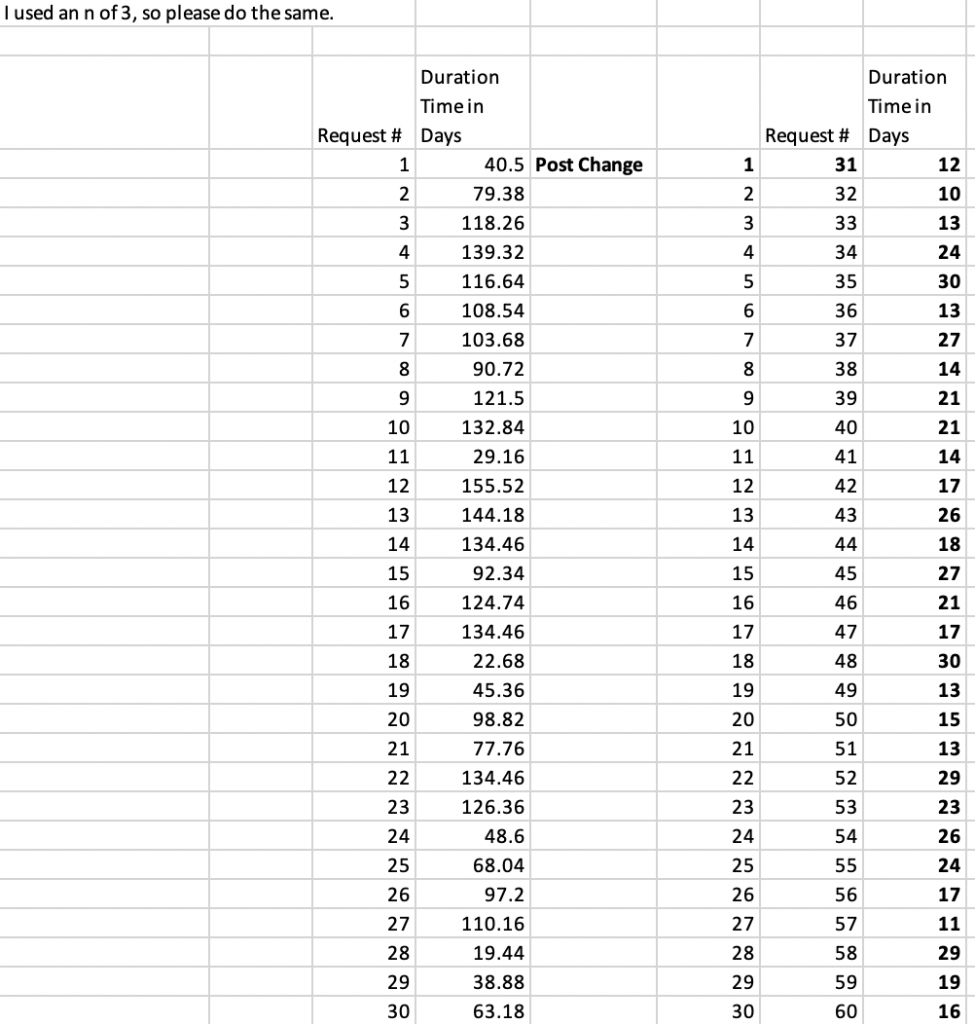
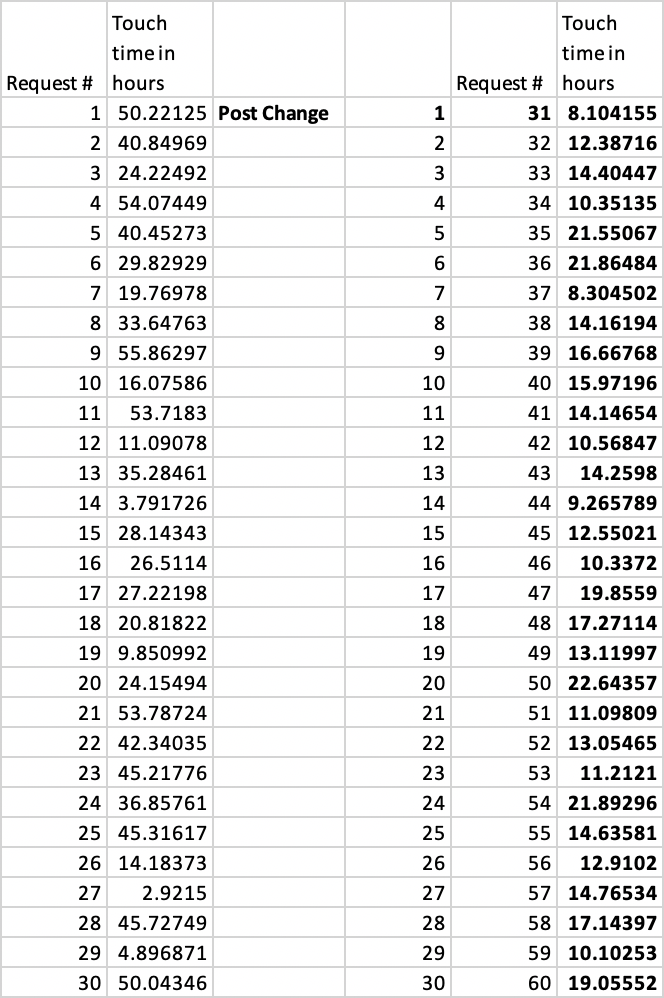
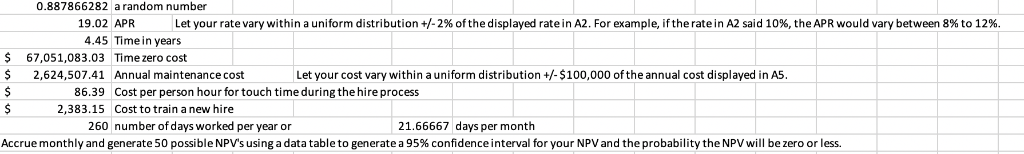
The second data set, Errors on Request shows what happened to the numbers of errors on the request form pre and post process change. These errors included inconsistent TDRs for given jobs, missing information, and information in the wrong place. The third data set, Total duration time, shows how long the process used to take and then what happened to the duration time of the hiring process post process treatment. The time tracked was from the time it was decided to fill out a request to the time the selection decision was made. The Actual Touch Time data set displays just actual work time needed to complete each hire. Other data were gathered for the process, but the company decided it was not relevant. They could not determine how to display the data in the data sets provided, that is your job. The information needed to do a cost benefit analysis is on the last sheet, do not pay attention to the random number in the first row on that sheet, it has no relevance to the test.
Test outputs
- Create appropriate chart/s for each set of data and talk about what is going on in each and what you would do (how would you use them if you do use them) with these charts in the future.
- Does the new, controlled process produce the correct product?
- Is the new process a good investment (NPV with a 95% confidence interval)? You need to develop Monte Carlo simulations where needed to develop realistic cash flows.
- Delineate a control process for the hiring process by briefly addressing the last 15 steps of the quality control policy. In the course of developing the 15 points, discus at least six things you would measure. You can include the measures taken to produce the data in the accompanying excel sheet.
 Please answer the question in excel.
hired/req complaint 119 153 102 136 complaint #hired/requests 1 1870 1887 1377 136 Post Change 255 187 442 612 816 782 1564 1071 765 799 459 629 595 986 765 952 986 629 544 561 629 816 714 595 493 833 476 901 1649 1275 782 425 425 255 170 119 119 153 119 9 289 1360 1649 952 714 850 1054 765 1938 1088 1836 1207 1972 1853 1972 1955 136 306 255 119 119 170 153 153 391 170 153 289 204 102 153 918 1853 1632 935 544 901 102 425 833 765 1836 1088 170 204 306 153 850 969 527 765 153 102 I used an n of 3, so please do the same. Duration Time in Duration Time in Request # Days Request # Days 12 10 13 24 30 13 27 14 21 21 1 40.5 Post Change 32 79.38 118.26 139.32 116.64 108.54 4 4 35 36 37 38 39 40 103.68 90.72 121.5 132.84 29.16 155.52 144.18 134.46 92.34 124.74 134.46 22.68 45.36 98.82 77.76 134.46 126.36 48.6 68.04 97.2 10 10 17 26 18 27 42 14 45 16 17 18 19 20 17 30 13 15 13 29 23 26 24 17 19 20 49 50 52 53 23 24 25 26 27 28 29 30 24 56 57 58 59 60 26 110.16 19.44 38.88 63.18 29 19 16 30 Touch Touch time in time in Request # hours 1 Request # hours 31 8.104155 1 50.22125 Post Change 2 40.84969 3 24.22492 4 54.07449 540.45273 6 29.82929 7 19.76978 833.64763 9 55.86297 32 12.38716 33 14.40447 34 10.35135 35 21.55067 36 21.86484 37 8.304502 38 14.16194 39 16.66768 40 15.97196 41 14.14654 42 10.56847 43 14.2598 44 9.265789 45 12.55021 46 10.3372 47 19.8559 48 17.27114 49 13.11997 50 22.64357 51 11.09809 52 13.05465 53 11.2121 54 21.89296 55 14.63581 56 12.9102 10 10 16.07586 1153.7183 12 11.09078 13 35.28461 14 3.791726 15 28.14343 16 26.5114 17 27.22198 18 20.81822 19 9.850992 2024.15494 2153.78724 2242.34035 2345.21776 24 36.85761 2545.31617 26 14.18373 27 2.9215 2845.72749 29 4.896871 30 50.04346 12 13 14 15 16 17 18 19 20 21 23 24 25 26 27 28 29 30 57 14.76534 58 17.14397 59 10.10253 60 19.05552 0.887866282 a random number 19.02 APR Let your r te ary within a uniform distribution+ 2% ofthe displayed ra ein A2 Fore ample, thera ein A2 1010%, theAP would ar beter 4.45 Time in years %10% 67,051,083.03 Timezero cost $2,624,507.41 Annual maintenance cost Let your cost vary within a uniform distribution$100,000 of the annual cost displayed in A5 86.39 2,383.15 Cost per person hour for touch time during the hire process Cost to train a new hire 260 number of days worked per year or 21.66667 Accrue monthly and generate 50 possible NPV's using a data table to generate a 95% confidence interval for your NPV and the probability the NPV will be zero or less. days per month hired/req complaint 119 153 102 136 complaint #hired/requests 1 1870 1887 1377 136 Post Change 255 187 442 612 816 782 1564 1071 765 799 459 629 595 986 765 952 986 629 544 561 629 816 714 595 493 833 476 901 1649 1275 782 425 425 255 170 119 119 153 119 9 289 1360 1649 952 714 850 1054 765 1938 1088 1836 1207 1972 1853 1972 1955 136 306 255 119 119 170 153 153 391 170 153 289 204 102 153 918 1853 1632 935 544 901 102 425 833 765 1836 1088 170 204 306 153 850 969 527 765 153 102 I used an n of 3, so please do the same. Duration Time in Duration Time in Request # Days Request # Days 12 10 13 24 30 13 27 14 21 21 1 40.5 Post Change 32 79.38 118.26 139.32 116.64 108.54 4 4 35 36 37 38 39 40 103.68 90.72 121.5 132.84 29.16 155.52 144.18 134.46 92.34 124.74 134.46 22.68 45.36 98.82 77.76 134.46 126.36 48.6 68.04 97.2 10 10 17 26 18 27 42 14 45 16 17 18 19 20 17 30 13 15 13 29 23 26 24 17 19 20 49 50 52 53 23 24 25 26 27 28 29 30 24 56 57 58 59 60 26 110.16 19.44 38.88 63.18 29 19 16 30 Touch Touch time in time in Request # hours 1 Request # hours 31 8.104155 1 50.22125 Post Change 2 40.84969 3 24.22492 4 54.07449 540.45273 6 29.82929 7 19.76978 833.64763 9 55.86297 32 12.38716 33 14.40447 34 10.35135 35 21.55067 36 21.86484 37 8.304502 38 14.16194 39 16.66768 40 15.97196 41 14.14654 42 10.56847 43 14.2598 44 9.265789 45 12.55021 46 10.3372 47 19.8559 48 17.27114 49 13.11997 50 22.64357 51 11.09809 52 13.05465 53 11.2121 54 21.89296 55 14.63581 56 12.9102 10 10 16.07586 1153.7183 12 11.09078 13 35.28461 14 3.791726 15 28.14343 16 26.5114 17 27.22198 18 20.81822 19 9.850992 2024.15494 2153.78724 2242.34035 2345.21776 24 36.85761 2545.31617 26 14.18373 27 2.9215 2845.72749 29 4.896871 30 50.04346 12 13 14 15 16 17 18 19 20 21 23 24 25 26 27 28 29 30 57 14.76534 58 17.14397 59 10.10253 60 19.05552 0.887866282 a random number 19.02 APR Let your r te ary within a uniform distribution+ 2% ofthe displayed ra ein A2 Fore ample, thera ein A2 1010%, theAP would ar beter 4.45 Time in years %10% 67,051,083.03 Timezero cost $2,624,507.41 Annual maintenance cost Let your cost vary within a uniform distribution$100,000 of the annual cost displayed in A5 86.39 2,383.15 Cost per person hour for touch time during the hire process Cost to train a new hire 260 number of days worked per year or 21.66667 Accrue monthly and generate 50 possible NPV's using a data table to generate a 95% confidence interval for your NPV and the probability the NPV will be zero or less. days per month
Step by Step Solution
There are 3 Steps involved in it

Get step-by-step solutions from verified subject matter experts