

Question: Testing: Ho : p = 0.69 H1 : p + 0.69 Your sample consists of 139 subjects, with 91 successes. Calculate the test statistic, rounded
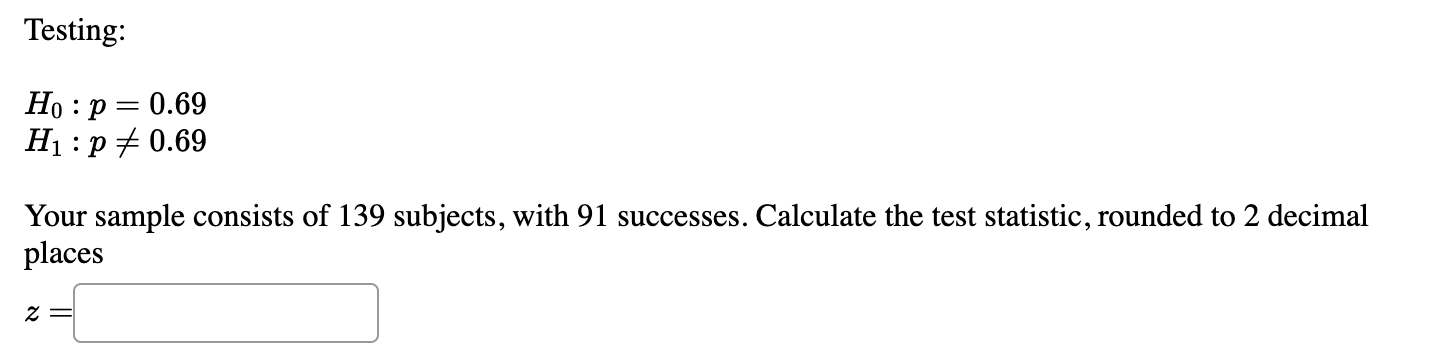
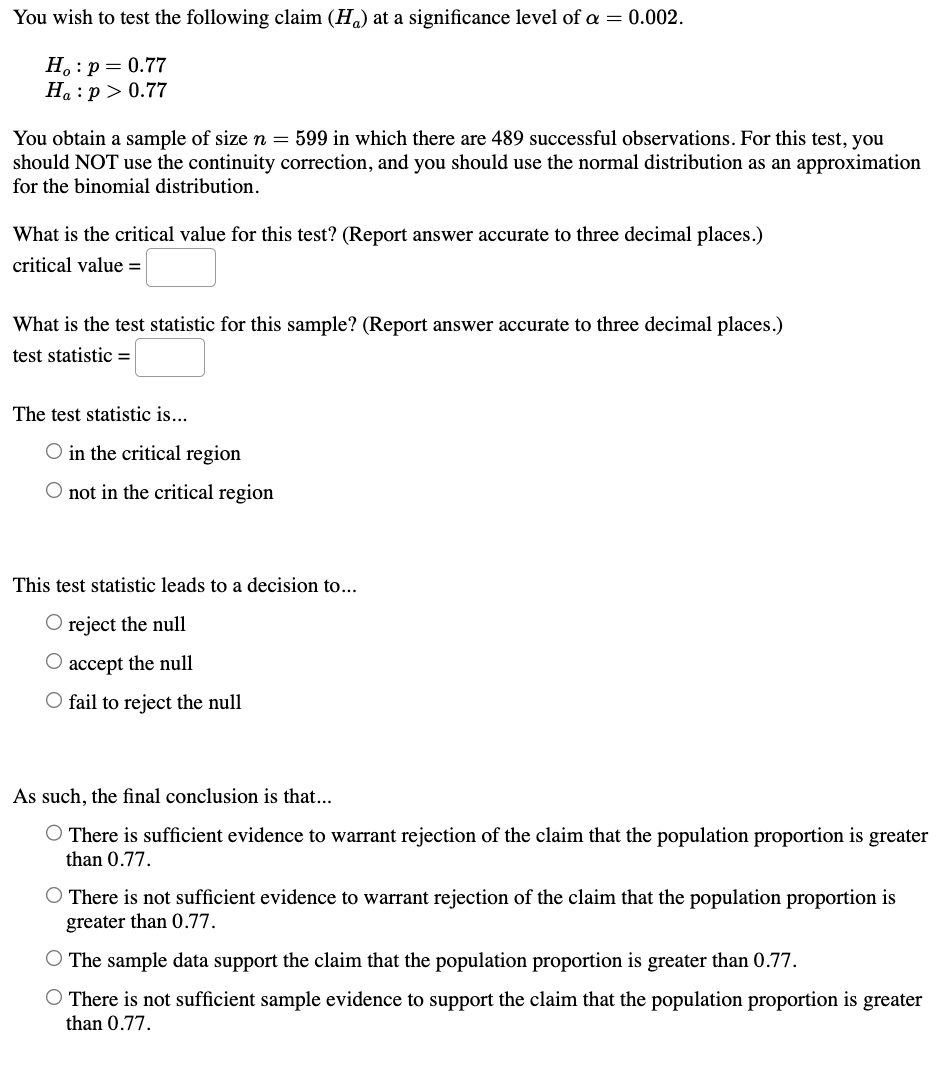
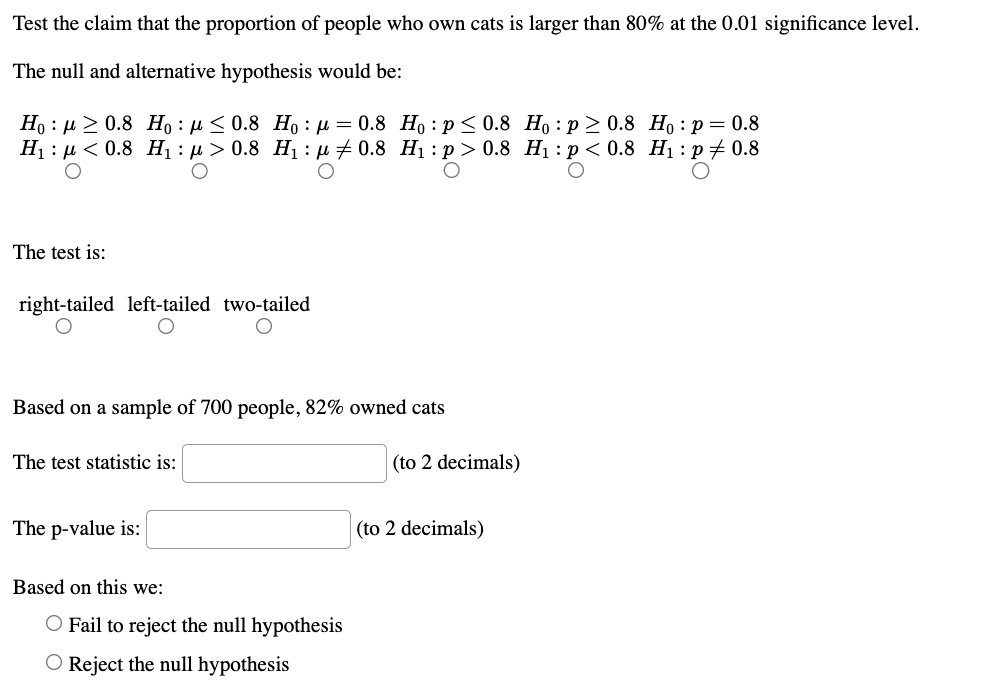
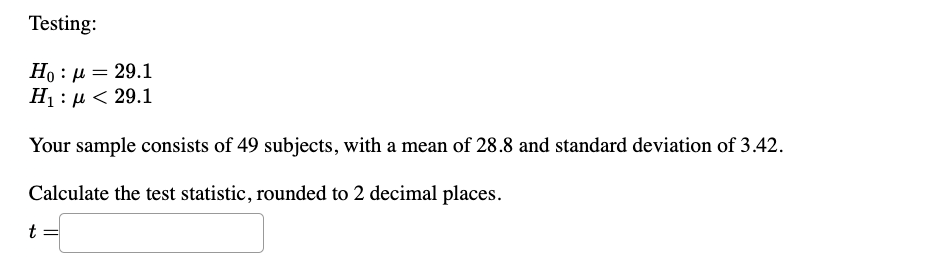
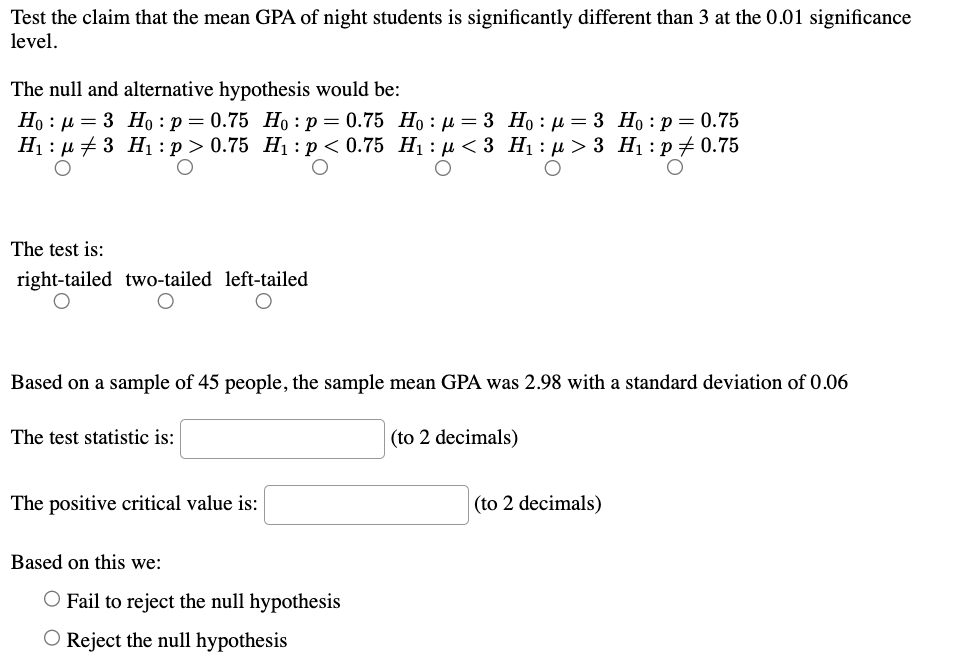
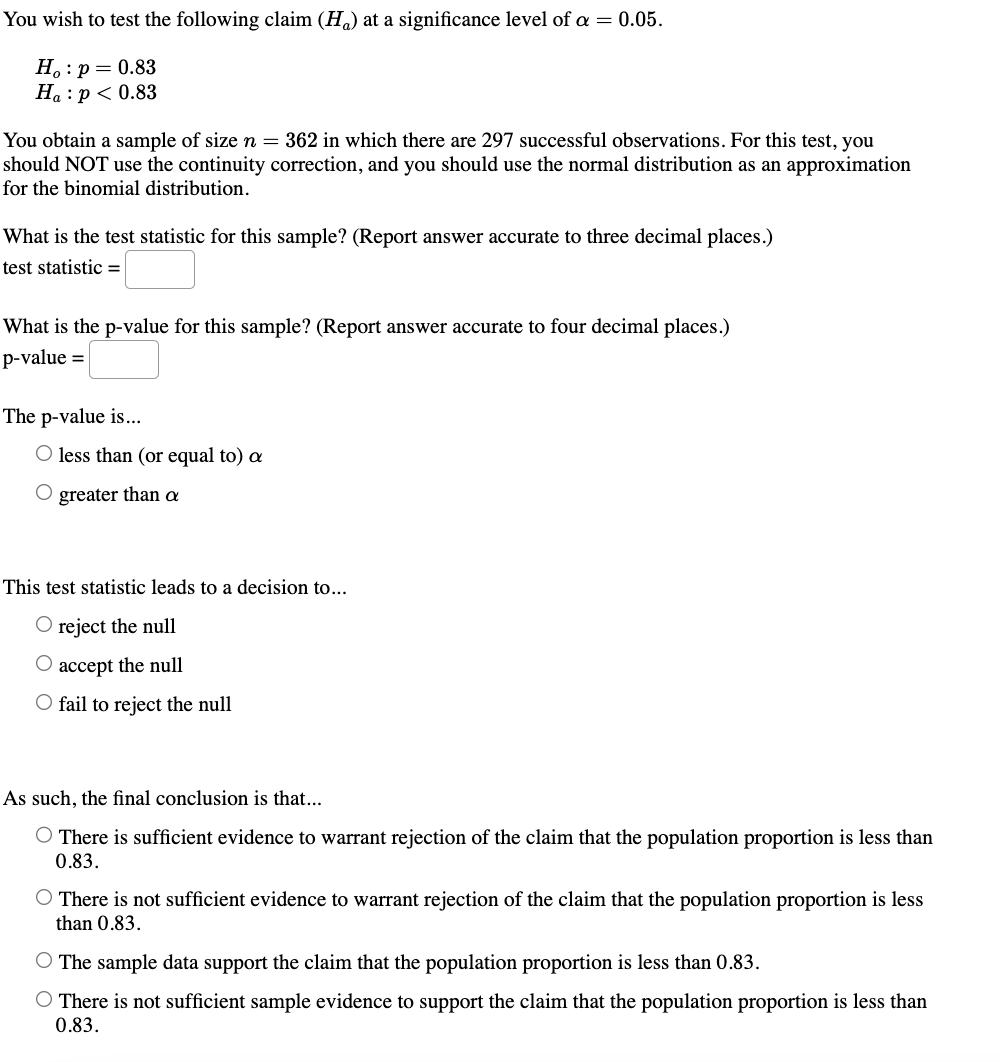
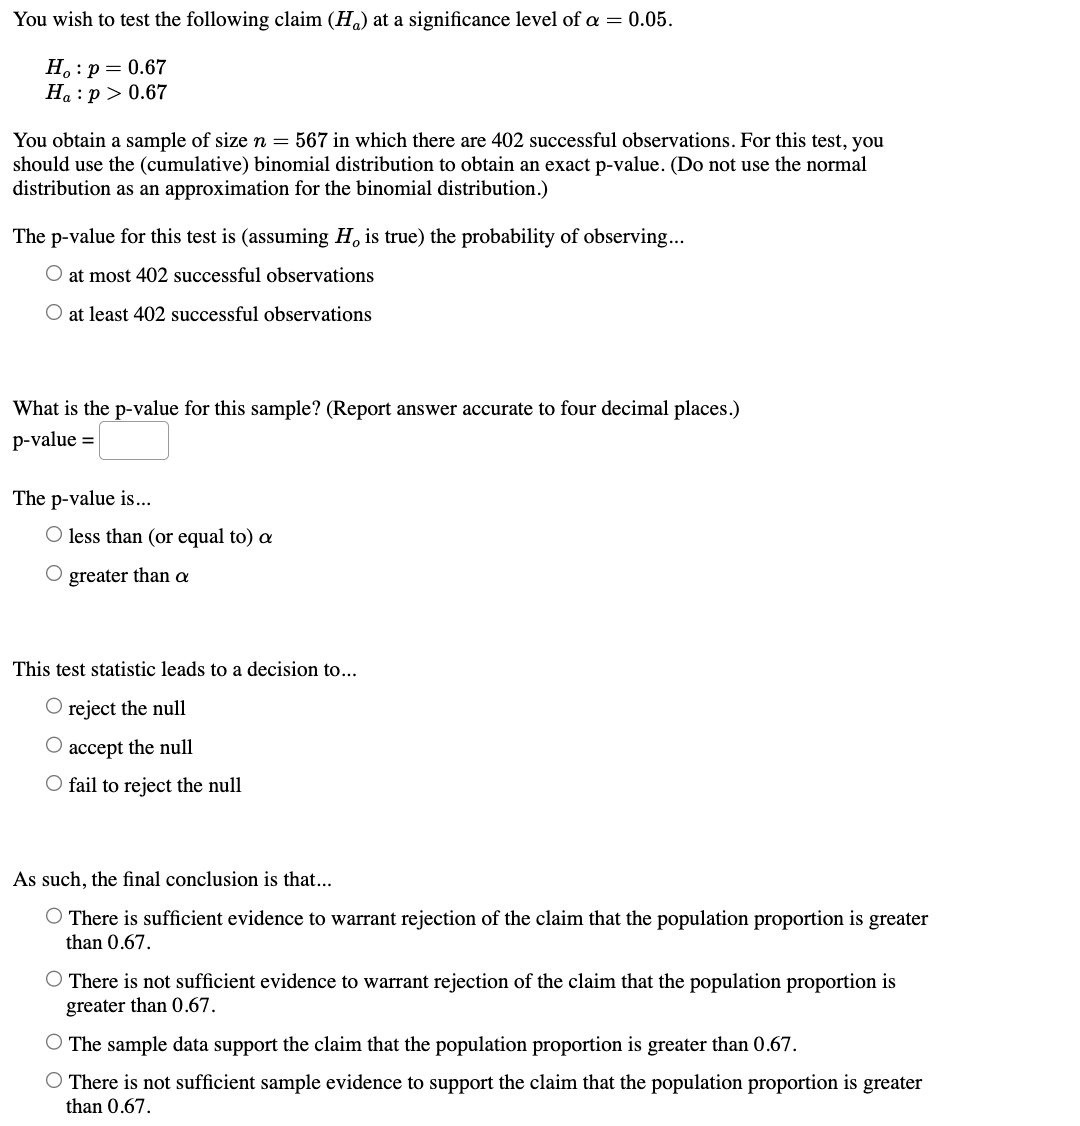
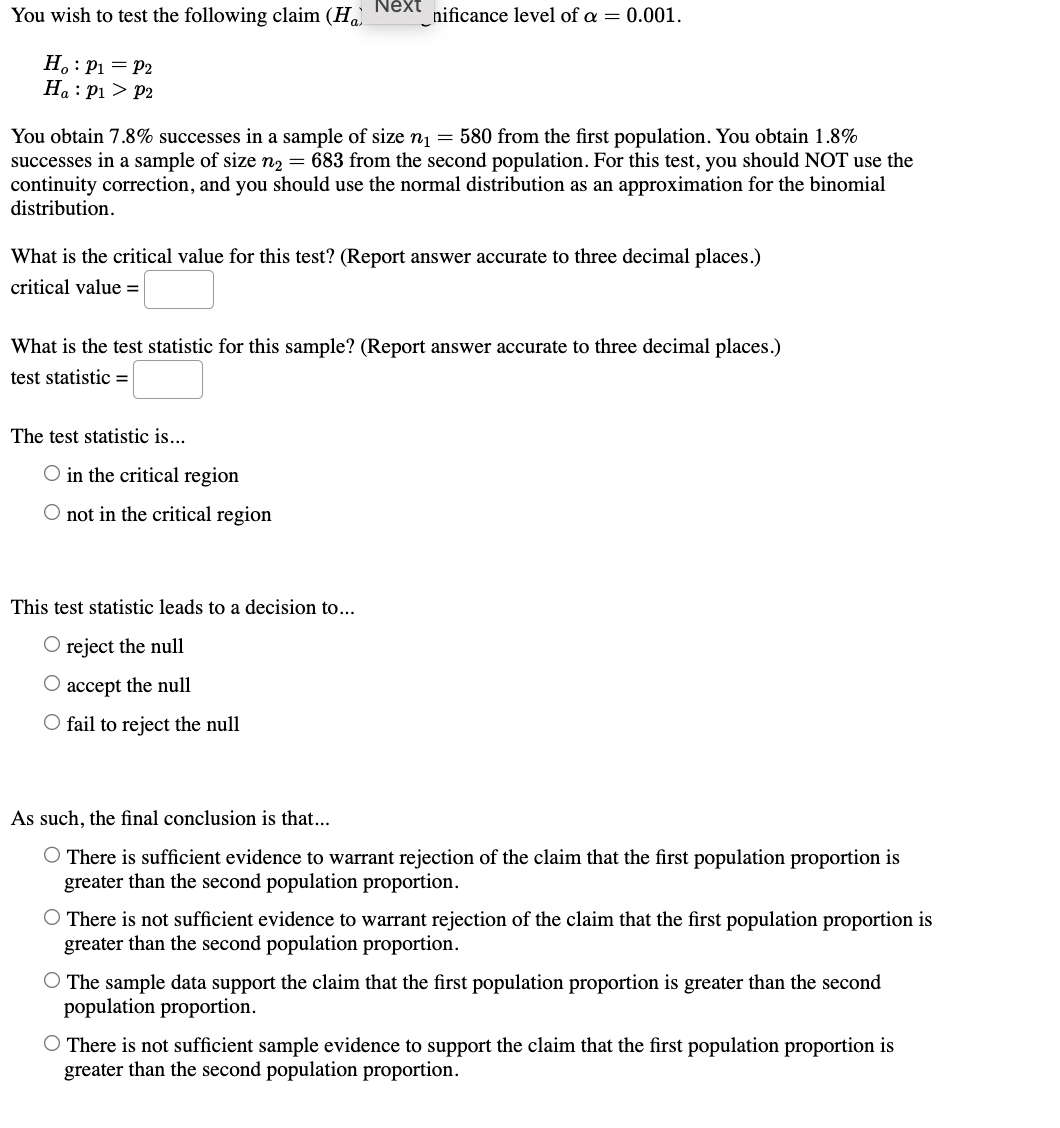
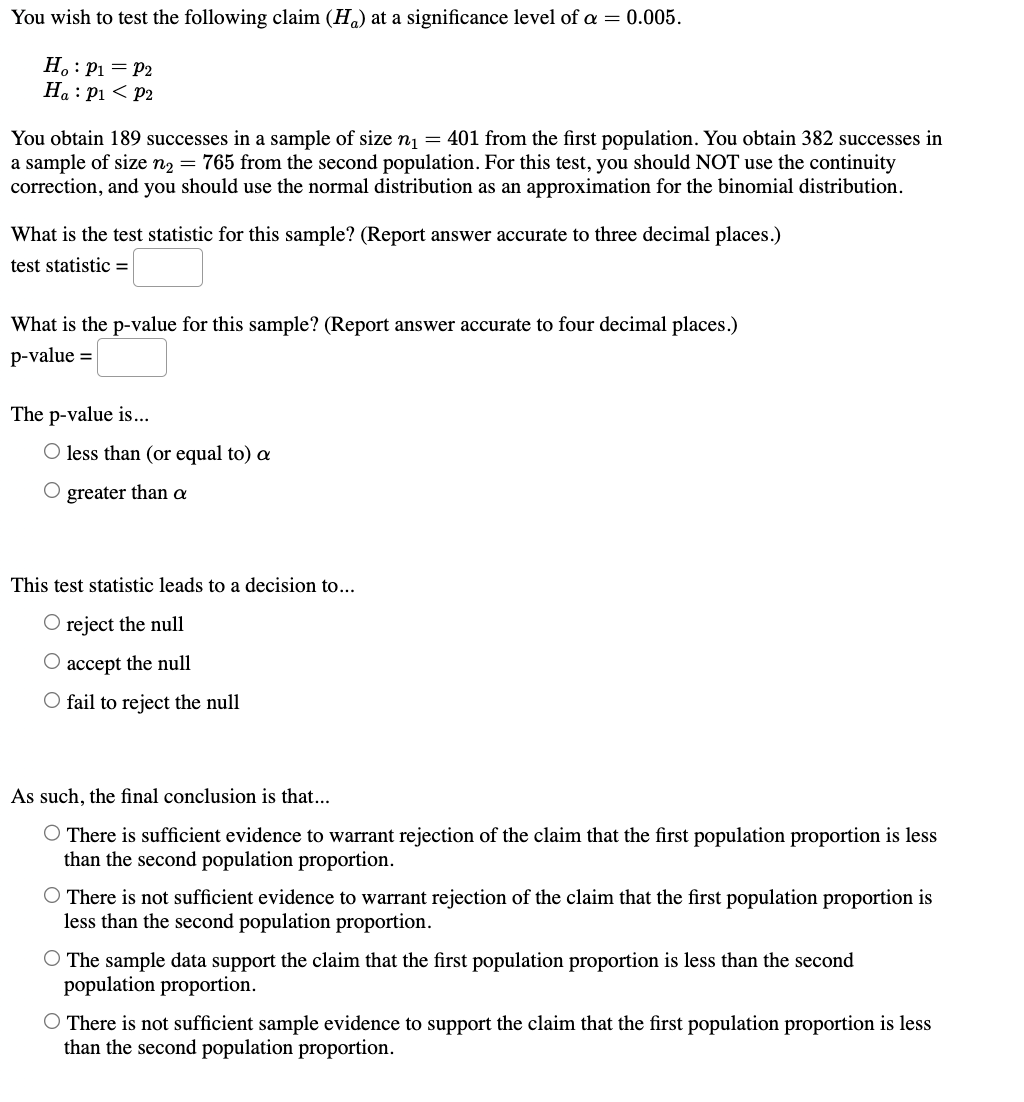
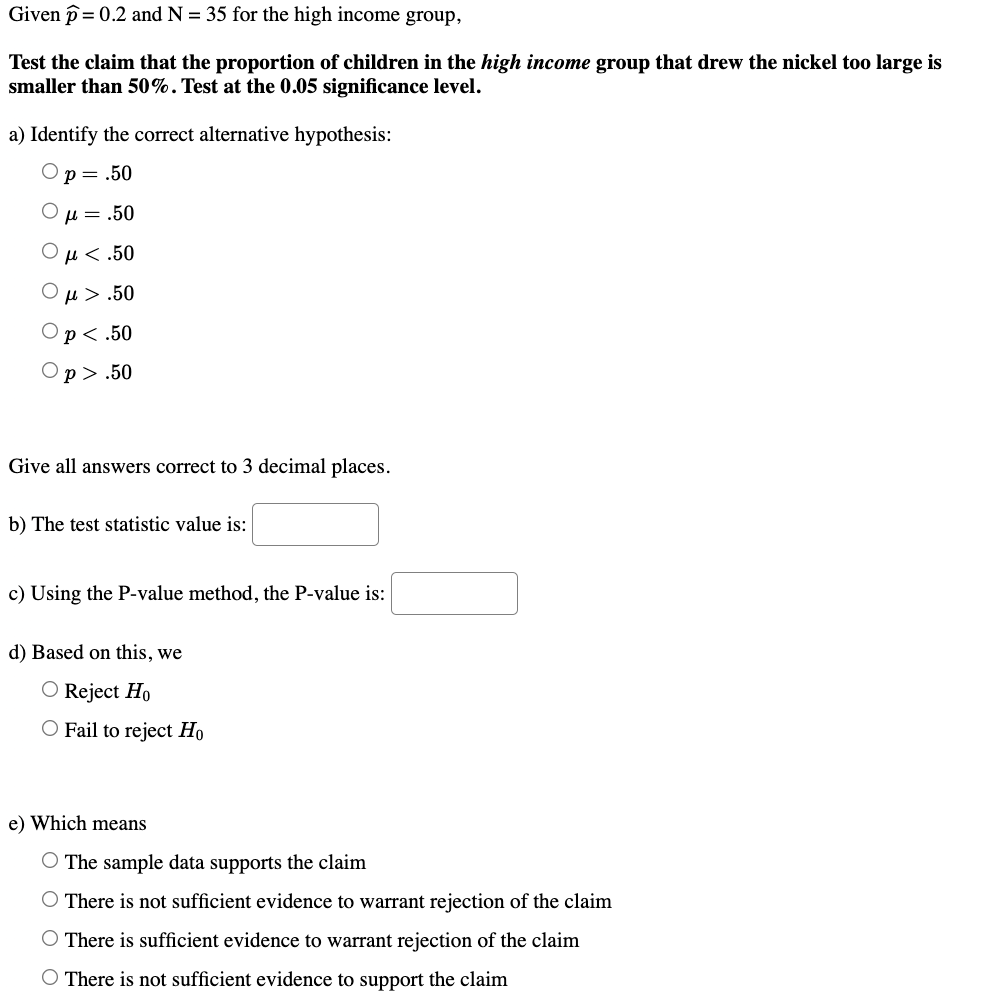
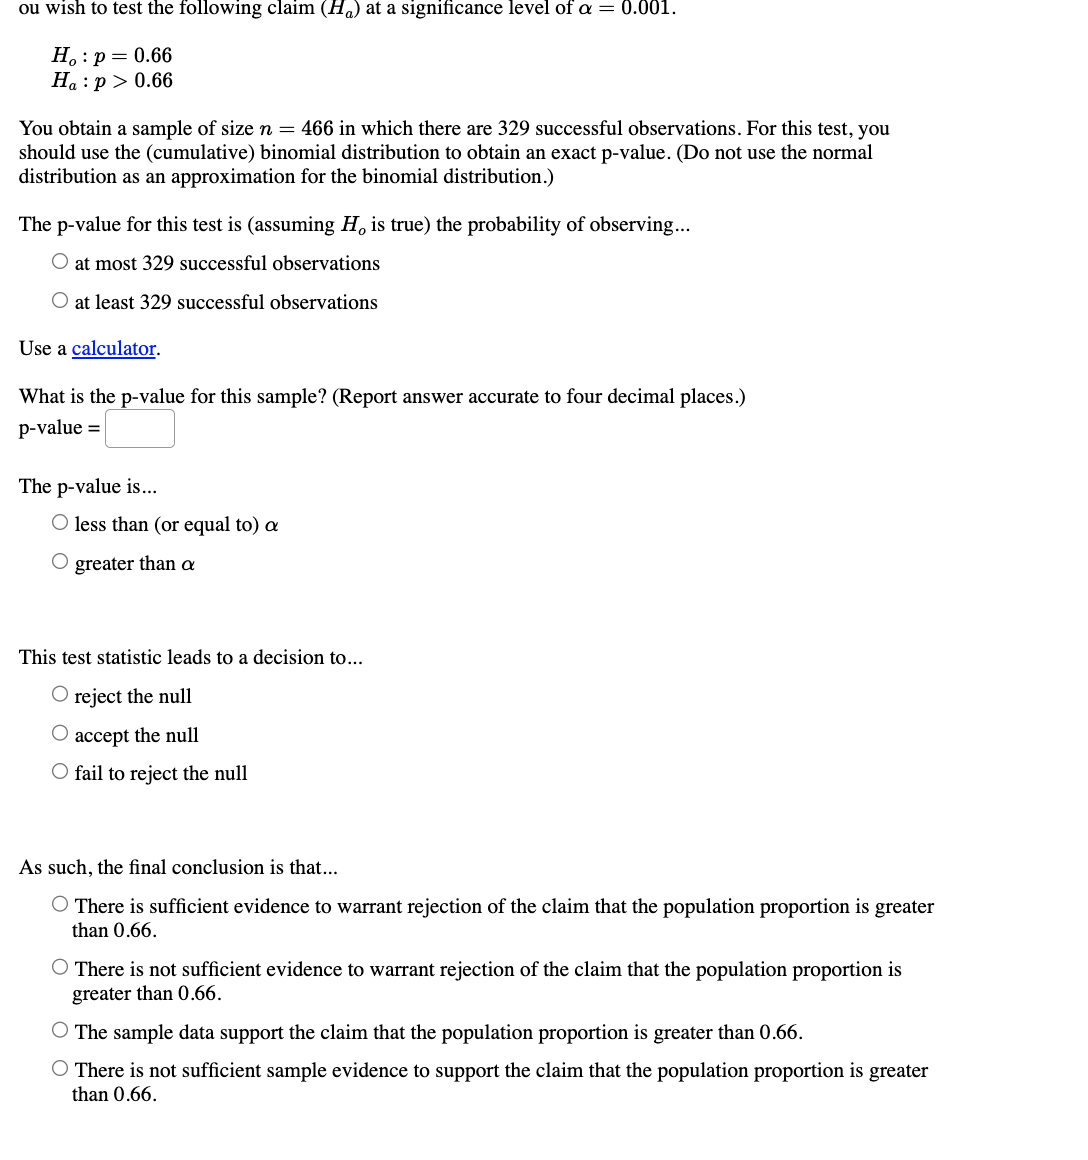
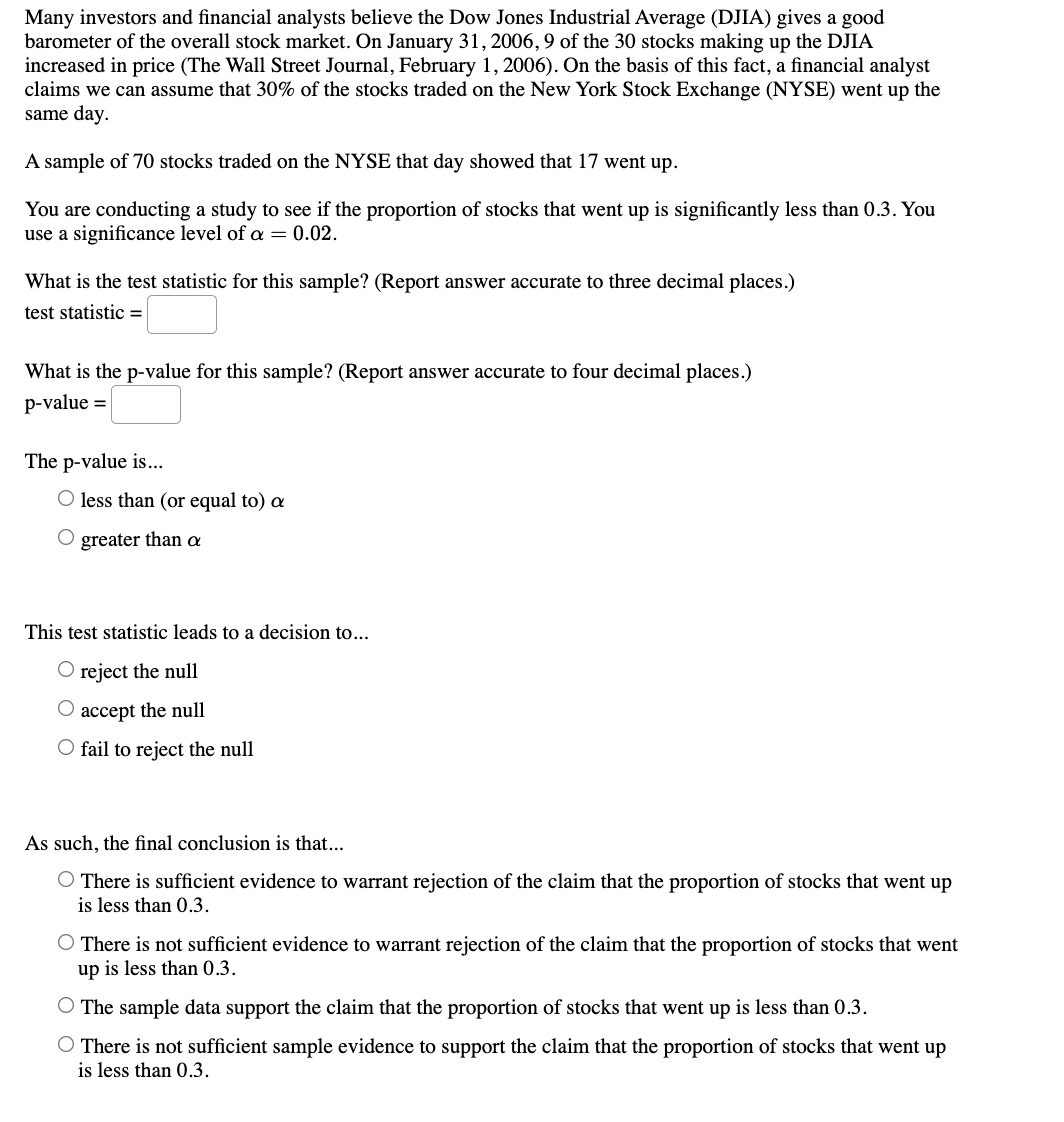
Testing: Ho : p = 0.69 H1 : p + 0.69 Your sample consists of 139 subjects, with 91 successes. Calculate the test statistic, rounded to 2 decimal places ZYou wish to test the following claim (Ha) at a significance level of a = 0.002. Ho : p = 0.77 Ha : p > 0.77 You obtain a sample of size n = 599 in which there are 489 successful observations. For this test, you should NOT use the continuity correction, and you should use the normal distribution as an approximation for the binomial distribution. What is the critical value for this test? (Report answer accurate to three decimal places.) critical value = What is the test statistic for this sample? (Report answer accurate to three decimal places.) test statistic = The test statistic is... in the critical region not in the critical region This test statistic leads to a decision to... O reject the null O accept the null O fail to reject the null As such, the final conclusion is that... There is sufficient evidence to warrant rejection of the claim that the population proportion is greater than 0.77. O There is not sufficient evidence to warrant rejection of the claim that the population proportion is greater than 0.77. The sample data support the claim that the population proportion is greater than 0.77. There is not sufficient sample evidence to support the claim that the population proportion is greater than 0.77.Test the claim that the proportion of people who own cats is larger than 80% at the 0.01 significance level. The null and alternative hypothesis would be: Ho: M 20.8 Ho: M 0.8 Ho : M =0.8 Ho : p 0.8 H1 : p0.8 H1 :p > 0.8 H1 : p 0.75 H1 : p 3 H1 :p / 0.75 The test is: right-tailed two-tailed left-tailed O O Based on a sample of 45 people, the sample mean GPA was 2.98 with a standard deviation of 0.06 The test statistic is: (to 2 decimals) The positive critical value is: (to 2 decimals) Based on this we: O Fail to reject the null hypothesis O Reject the null hypothesisYou wish to test the following claim (Ha) at a significance level of a = 0.05. Ho : p = 0.83 Ha : p 0.67 You obtain a sample of size n = 567 in which there are 402 successful observations. For this test, you should use the (cumulative) binomial distribution to obtain an exact p-value. (Do not use the normal distribution as an approximation for the binomial distribution.) The p-value for this test is (assuming H. is true) the probability of observing... at most 402 successful observations O at least 402 successful observations What is the p-value for this sample? (Report answer accurate to four decimal places.) p-value = The p-value is... O less than (or equal to) a O greater than a This test statistic leads to a decision to... reject the null O accept the null O fail to reject the null As such, the final conclusion is that... There is sufficient evidence to warrant rejection of the claim that the population proportion is greater than 0.67. There is not sufficient evidence to warrant rejection of the claim that the population proportion is greater than 0.67. The sample data support the claim that the population proportion is greater than 0.67. There is not sufficient sample evidence to support the claim that the population proportion is greater than 0.67.You wish to test the following claim (Ha) nificance level of a = 0.001. Ho : P1 = P2 Ha : Pl > P2 You obtain 7.8% successes in a sample of size n1 = 580 from the first population. You obtain 1.8% successes in a sample of size n2 = 683 from the second population. For this test, you should NOT use the continuity correction, and you should use the normal distribution as an approximation for the binomial distribution. What is the critical value for this test? (Report answer accurate to three decimal places.) critical value = What is the test statistic for this sample? (Report answer accurate to three decimal places.) test statistic = The test statistic is... O in the critical region not in the critical region This test statistic leads to a decision to... O reject the null O accept the null O fail to reject the null As such, the final conclusion is that... There is sufficient evidence to warrant rejection of the claim that the first population proportion is greater than the second population proportion. There is not sufficient evidence to warrant rejection of the claim that the first population proportion is greater than the second population proportion. The sample data support the claim that the first population proportion is greater than the second population proportion. There is not sufficient sample evidence to support the claim that the first population proportion is greater than the second population proportion.You wish to test the following claim (Ha) at a significance level of a = 0.005. Ho : P1 = P2 Ha : P1 .50 Op <.50 op> .50 Give all answers correct to 3 decimal places. b) The test statistic value is: c) Using the P-value method, the P-value is: d) Based on this, we O Reject Ho Fail to reject Ho e) Which means The sample data supports the claim There is not sufficient evidence to warrant rejection of the claim There is sufficient evidence to warrant rejection of the claim There is not sufficient evidence to support the claimou wish to test the following claim (Ha) at a significance level of a = 0.001. Ho : p = 0.66 Ha : p > 0.66 You obtain a sample of size n = 466 in which there are 329 successful observations. For this test, you should use the (cumulative) binomial distribution to obtain an exact p-value. (Do not use the normal distribution as an approximation for the binomial distribution.) The p-value for this test is (assuming H. is true) the probability of observing... O at most 329 successful observations at least 329 successful observations Use a calculator. What is the p-value for this sample? (Report answer accurate to four decimal places.) p-value = The p-value is... O less than (or equal to) a greater than a This test statistic leads to a decision to... O reject the null O accept the null O fail to reject the null As such, the final conclusion is that... There is sufficient evidence to warrant rejection of the claim that the population proportion is greater than 0.66. There is not sufficient evidence to warrant rejection of the claim that the population proportion is greater than 0.66. The sample data support the claim that the population proportion is greater than 0.66. There is not sufficient sample evidence to support the claim that the population proportion is greater than 0.66.Many investors and financial analysts believe the Dow Jones Industrial Average (DJIA) gives a good barometer of the overall stock market. On January 31, 2006, 9 of the 30 stocks making up the DJIA increased in price (The Wall Street Journal, February 1, 2006). On the basis of this fact, a financial analyst claims we can assume that 30% of the stocks traded on the New York Stock Exchange (NYSE) went up the same day. A sample of 70 stocks traded on the NYSE that day showed that 17 went up. You are conducting a study to see if the proportion of stocks that went up is significantly less than 0.3. You use a significance level of a = 0.02. What is the test statistic for this sample? (Report answer accurate to three decimal places.) test statistic = What is the p-value for this sample? (Report answer accurate to four decimal places.) p-value = The p-value is... less than (or equal to) a greater than ox This test statistic leads to a decision to... O reject the null O accept the null O fail to reject the null As such, the final conclusion is that... There is sufficient evidence to warrant rejection of the claim that the proportion of stocks that went up is less than 0.3. There is not sufficient evidence to warrant rejection of the claim that the proportion of stocks that went up is less than 0.3. The sample data support the claim that the proportion of stocks that went up is less than 0.3. There is not sufficient sample evidence to support the claim that the proportion of stocks that went up is less than 0.3
Step by Step Solution
There are 3 Steps involved in it

Get step-by-step solutions from verified subject matter experts