

Question: testing hypothesis with your class data Activity 4: Testing hypotheses with your class data This activity uses your class dataset. Making the dubious assumption that
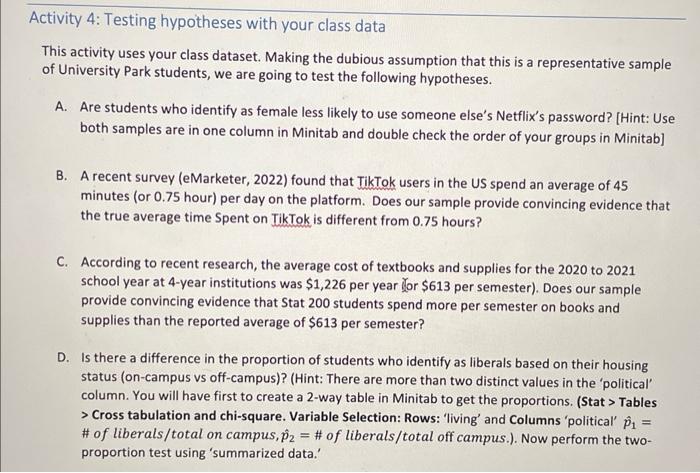
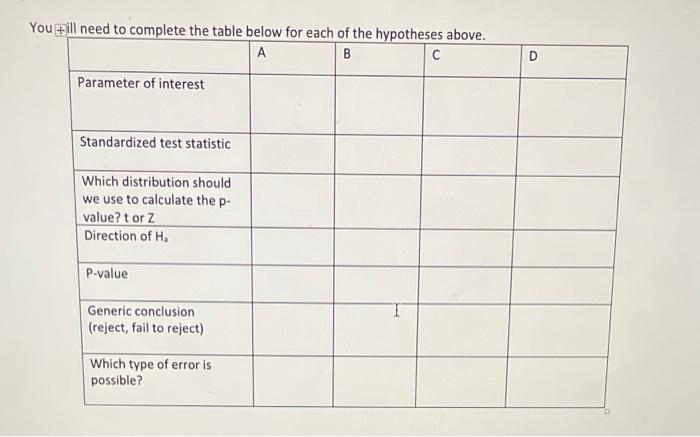
Activity 4: Testing hypotheses with your class data This activity uses your class dataset. Making the dubious assumption that this is a representative sample of University Park students, we are going to test the following hypotheses. A. Are students who identify as female less likely to use someone else's Netflix's password? [Hint: Use both samples are in one column in Minitab and double check the order of your groups in Minitab] B. A recent survey (eMarketer, 2022) found that TikTok users in the US spend an average of 45 minutes (or 0.75 hour) per day on the platform. Does our sample provide convincing evidence that the true average time Spent on TikTok is different from 0.75 hours? C. According to recent research, the average cost of textbooks and supplies for the 2020 to 2021 school year at 4-year institutions was $1,226 per year (Tor $613 per semester). Does our sample provide convincing evidence that Stat 200 students spend more per semester on books and supplies than the reported average of $613 per semester? D. Is there a difference in the proportion of students who identify as liberals based on their housing status (on-campus vs off-campus)? (Hint: There are more than two distinct values in the 'political' column. You will have first to create a 2-way table in Minitab to get the proportions. (Stat > Tables > Cross tabulation and chi-square. Variable Selection: Rows: 'living' and Columns 'political' p^1= \# of liberals/total on campus, p^2= \# of liberals/total off campus.). Now perform the twoproportion test using 'summarized data.' You ill need to complete the table below for earh of tha hunnthocac ahnus Activity 4: Testing hypotheses with your class data This activity uses your class dataset. Making the dubious assumption that this is a representative sample of University Park students, we are going to test the following hypotheses. A. Are students who identify as female less likely to use someone else's Netflix's password? [Hint: Use both samples are in one column in Minitab and double check the order of your groups in Minitab] B. A recent survey (eMarketer, 2022) found that TikTok users in the US spend an average of 45 minutes (or 0.75 hour) per day on the platform. Does our sample provide convincing evidence that the true average time Spent on TikTok is different from 0.75 hours? C. According to recent research, the average cost of textbooks and supplies for the 2020 to 2021 school year at 4-year institutions was $1,226 per year (Tor $613 per semester). Does our sample provide convincing evidence that Stat 200 students spend more per semester on books and supplies than the reported average of $613 per semester? D. Is there a difference in the proportion of students who identify as liberals based on their housing status (on-campus vs off-campus)? (Hint: There are more than two distinct values in the 'political' column. You will have first to create a 2-way table in Minitab to get the proportions. (Stat > Tables > Cross tabulation and chi-square. Variable Selection: Rows: 'living' and Columns 'political' p^1= \# of liberals/total on campus, p^2= \# of liberals/total off campus.). Now perform the twoproportion test using 'summarized data.' You ill need to complete the table below for earh of tha hunnthocac ahnus
Step by Step Solution
There are 3 Steps involved in it

Get step-by-step solutions from verified subject matter experts