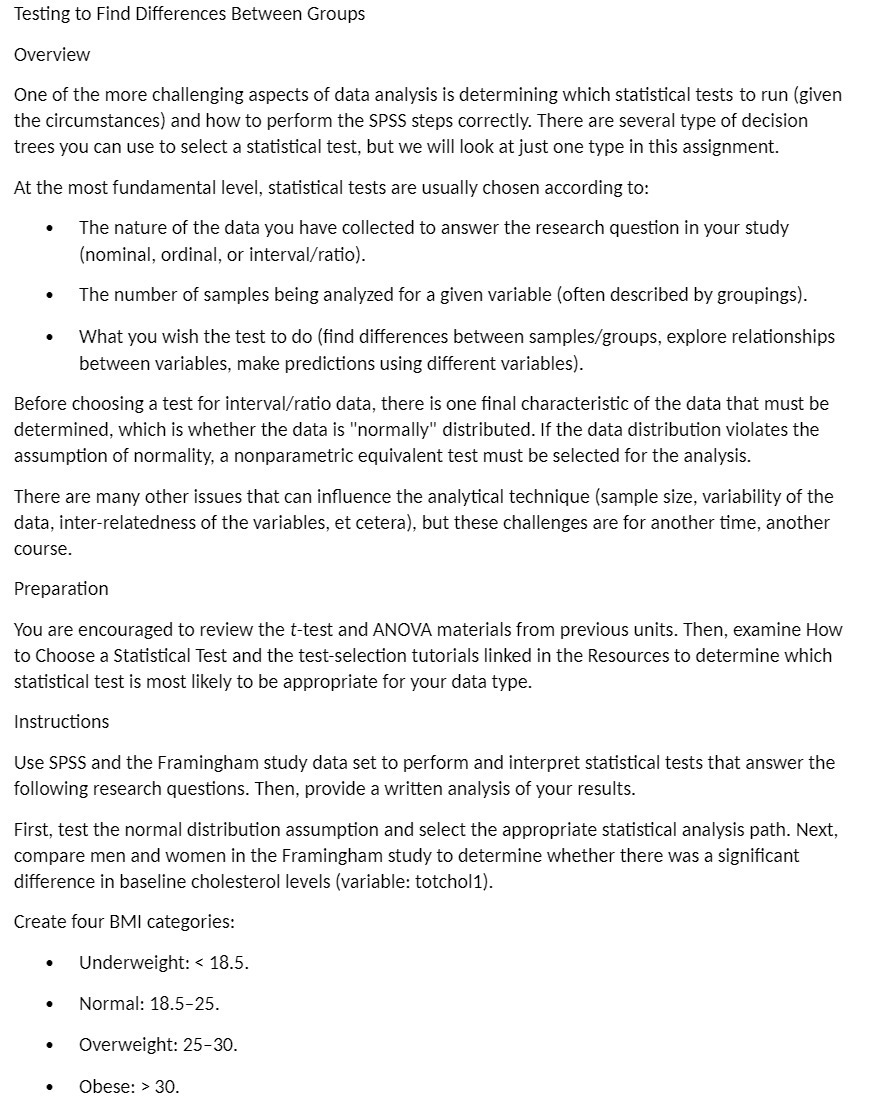
Question: Testing to Find Differences Between Groups Overview One of the more challenging aspects of data analysis is determining which statistical tests to run {given the

Testing to Find Differences Between Groups
Testing to Find Differences Between Groups Overview One of the more challenging aspects of data analysis is determining which statistical tests to run {given the circumstances) and how to perform the SPSS steps correctly. There are several type of decision trees you can use to select a statistical test, but we will look atjust one type in this assignment. At the most fundamental level, statistical tests are usually chosen according to: . The nature of the data you have collected to answer the research question in your study (nominal, ordinal, or intervalz'ratio). o The number of samples being analyzed for a given variable [often described by groupings]. o What you wish the test to do {nd differences between samplesfgroups, explore relationships between variables, make predictions using different variables]. Before choosing a test for intervalfratio data, there is one nal characteristic of the data that must be determined, which is whether the data is "normally" distributed. If the data distribution violates the assumption of normality, a nonparametric equivalent test must be selected for the analysis. There are many other issues that can inuence the analytical technique (sample size, variability of the data, interrelatedness of the variables, et cetera), but these challenges are for another time, another course. Preparation You are encouraged to review the ttest and ANOVA materials from previous units. Then, examine How to Choose a Statistical Test and the testselecon tutorials linked in the Resources to determine which statistical test is most likely to be appropriate for your data type. Instructions Use SPSS and the Framingham study data set to perform and interpret statistical tests that answer the following research questions. Then, provide a written analysis of your results. First, test the normal distribution assumption and select the appropriate statistical analysis path. Next, compare men and women in the Framingham study to determine whether there was a signicant difference in baseline cholesterol levels (variable: totcholl]. Create four BMI categories: . Underweight: 30

Step by Step Solution

There are 3 Steps involved in it

1 Expert Approved Answer
Step: 1 Unlock blur-text-image
Question Has Been Solved by an Expert!

Get step-by-step solutions from verified subject matter experts

Step: 2 Unlock
Step: 3 Unlock

Students Have Also Explored These Related Mathematics Questions!