

Question: #' # textcolor{blue}{Setup code} #' #' **Add code here to load required packages, read data, etc. - preliminary tasks you need to perform to answer
#' # \textcolor{blue}{Setup code} #' #' **Add code here to load required packages, read data, etc. - preliminary tasks you need to perform to answer the HW questions.** #'
# YOUR CODE HERE
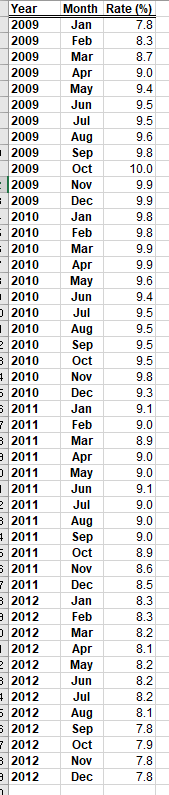
#' #' --- #' #' ## \textcolor{blue}{Question 1} #' #' **Plot the time series.** #' #' *Hint:* You should have time on the X-axis. It will suffice to label a few of the years on the X-axis. Don't worry about showing every year and/or every month on the plot. #'
# YOUR CODE HERE #' YOUR INSIGHTS HERE
#' #' --- #' #' ## \textcolor{blue}{Question 2} #' #' **List the components that you believe are present in the time series (provide an argument for the presence or absence of each).** #' #' *Hint:* Discuss each of the four components of a time series. #'
# YOUR CODE HERE #' YOUR INSIGHTS HERE
#' #' --- #' #' ## \textcolor{blue}{Question 3} #' #' **Generate 3- and 12-month moving average forecasts for this data. You should generate forecasts until May 2013. ** #' #' *Hint:* You should generate 5 forecasts using each model (10 forecasts in total). The forecast for Jan 2013 should be 7.83 using a 3-month moving average and it should be 8.075 using a 12-month moving average. #' # YOUR CODE HERE #' YOUR INSIGHTS HERE
#' #' --- #' #' ## \textcolor{blue}{Question 4} #' #' **Calculate simple exponential smoothing forecasts for the unemployment rate data using $\alpha = 0.2$ and $\alpha = 0.3$. You should generate forecasts until May 2013. ** #' #' *Hint:* The Jan 2023 forecast should be 8.015 using $\alpha = 0.2$ and 7.912 using $\alpha = 0.2$. #'
# YOUR CODE HERE #' YOUR INSIGHTS HERE
#' #' --- #' #' ## \textcolor{blue}{Question 5} #' #' **Generate a plot that shows the actual unemployment rates, as well as the fitted values (on historical data) using the four techniques you used above (3- and 12-month moving averages and simple exponential smoothing with =0.2, 0.3). You can start by plotting the time series and adding the fitted values using the lines() function. Please be sure to add axes titles and a legend to your plot.** #'
# YOUR CODE HERE #' YOUR INSIGHTS HERE
#' #' --- #' #' ## \textcolor{blue}{Question 6} #' #' **If you must choose a forecasting technique based on the forecast performance on historical data, which of the four forecasting techniques would you recommend? Use one bias measure (ME) and one variance measure (MAE) to make this determination. Please offer a technical and a managerial explanation for your choice. A managerial explanation is something that you could explain to a business user who does not understand the technical terminology and details.** #' #' *Hint:* The absolute value of the ME for the 3-month moving average should be close to 0.01 and the MAE value for the 12-month moving average should be close to 0.4. The ME values for the two simple exponential smoothing models should be close to 0.08 and 0.04 in absolute value. #'
# YOUR CODE HERE #' YOUR INSIGHTS HERE
#' #' ---
Write Code in R.
.
\f
Step by Step Solution
There are 3 Steps involved in it

Get step-by-step solutions from verified subject matter experts