

Question: Thank you! 3. The data below give information about a sample of 9 oak trees in California. To predict the acorn size from the range
Thank you!
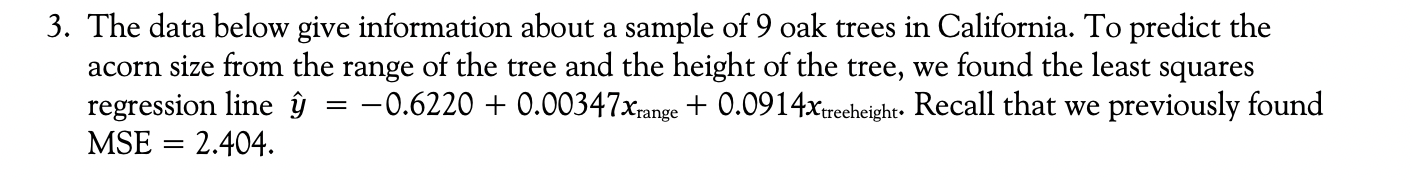

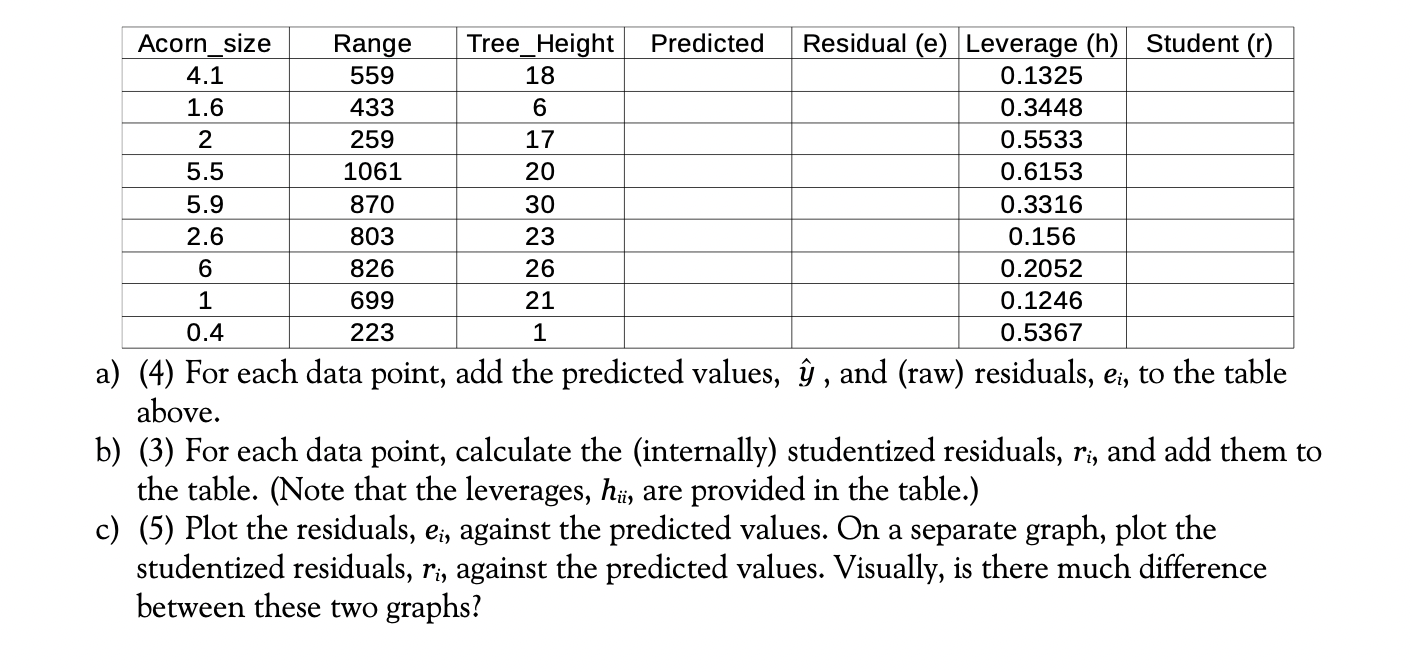
3. The data below give information about a sample of 9 oak trees in California. To predict the acorn size from the range of the tree and the height of the tree, we found the least squares regression line 3') = 0.6220 + 0.00347xrange + 0.0914xmheight. Recall that we previously found MSE = 2.404. Acorn_size Range Tree_Height Predicted Residual (e) Leverage (h) Student (r) 4.1 559 18 0.1325 1.6 433 6 0.3448 2 259 17 0.5533 5.5 1061 20 0.6153 5.9 870 30 0.3316 2.6 803 23 6 826 26 1 699 21 0.4 223 1 a) (4) For each data point, add the predicted values, 9 , and (raw) residuals, er, to the table above. b) (3) For each data point, calculate the (internally) studentized residuals, n, and add them to the table. (Note that the leverages, he, are provided in the table.) c) (5) Plot the residuals, 2,, against the predicted values. On a separate graph, plot the studentized residuals, ri, against the predicted values. Visually, is there much difference between these two graphs
Step by Step Solution
There are 3 Steps involved in it

Get step-by-step solutions from verified subject matter experts