

Question: Thank you!! Continuing with the data in Appendix B.11, which gives predictors for the quality of a wine: The ANOVA table and coefficients table for
Thank you!!
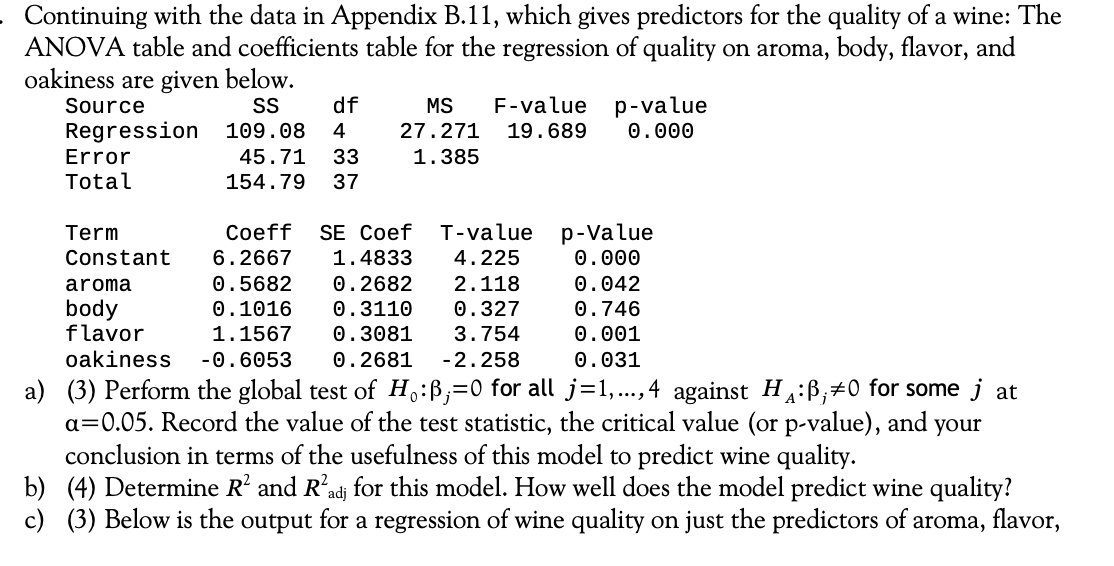
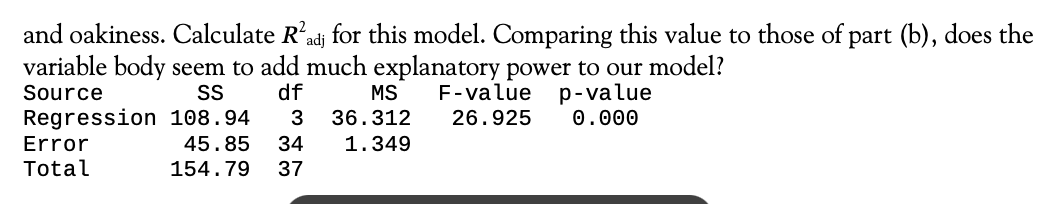
Continuing with the data in Appendix B.11, which gives predictors for the quality of a wine: The ANOVA table and coefficients table for the regression of quality on aroma, body, flavor, and oakiness are given below. Source SS df MS F-value p-value Regression 109.08 4 27.271 19.689 0 . 000 Error 45 . 71 33 1. 385 Total 154.79 37 Term Coeff SE Coef T-value p-Value Constant 6 . 2667 1. 4833 4. 225 0 . 000 aroma 0 . 5682 0 . 2682 2. 118 0 . 042 body 0 . 1016 0 . 3110 0. 327 0. 746 flavor 1 . 1567 0 . 3081 3. 754 0 . 001 oakiness -0 . 6053 0 . 2681 -2. 258 0 . 031 a) (3) Perform the global test of H.: B,=0 for all j=1,...,4 against HA: P,#0 for some j at a=0.05. Record the value of the test statistic, the critical value (or p-value), and your conclusion in terms of the usefulness of this model to predict wine quality. b) (4) Determine R' and Rad; for this model. How well does the model predict wine quality? c) (3) Below is the output for a regression of wine quality on just the predictors of aroma, flavor,and oakiness. Calculate Rid,- for this model. Comparing this value to those of part (b), does the variable body seem to add much explanatory power to our model? Source 85 df MS F-value p-value Regression 198.94 3 36.312 26.925 9.999 Error 45.85 34 1.349 Total 154.79 37 \f
Step by Step Solution
There are 3 Steps involved in it

Get step-by-step solutions from verified subject matter experts