

Question: thank you! . Question 10 Consider the following data set: 48.5 47.5 50.3 51.8 51.8 45.3 48.4 44.5 49.6 47.4 47.7 50.3 47.3 45 47.5
thank you!
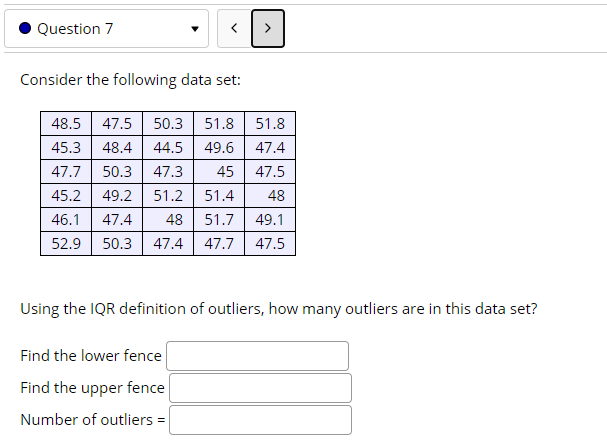
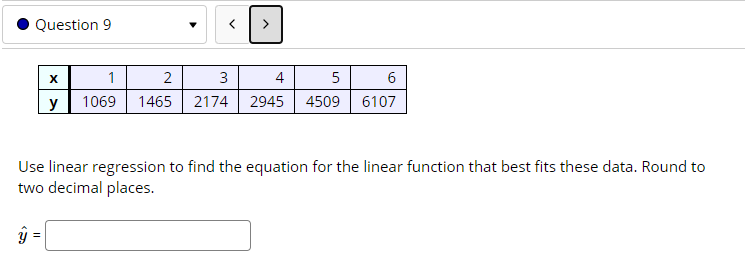
. Question 10 Consider the following data set: 48.5 47.5 50.3 51.8 51.8 45.3 48.4 44.5 49.6 47.4 47.7 50.3 47.3 45 47.5 45.2 49.2 51.2 51.4 48 46.1 47.4 48 51.7 49.1 52.9 50.3 47.4 47.7 47.5 Using the IQR definition of outliers, how many outliers are in this data set? Find the lower fence Find the upper fence Number of outliers =Question 9 > X 2 3 4 5 6 y 1069 1465 2174 2945 4509 6107 Use linear regression to find the equation for the linear function that best fits these data. Round to two decimal places. y =
Step by Step Solution
There are 3 Steps involved in it
1 Expert Approved Answer
Step: 1 Unlock

Question Has Been Solved by an Expert!
Get step-by-step solutions from verified subject matter experts
Step: 2 Unlock
Step: 3 Unlock