

Question: Thank you! Refer to the data in Appendix B. 11 (data available on Blackboard), which gives predictors for the quality of a wine. a) (8)
Thank you!
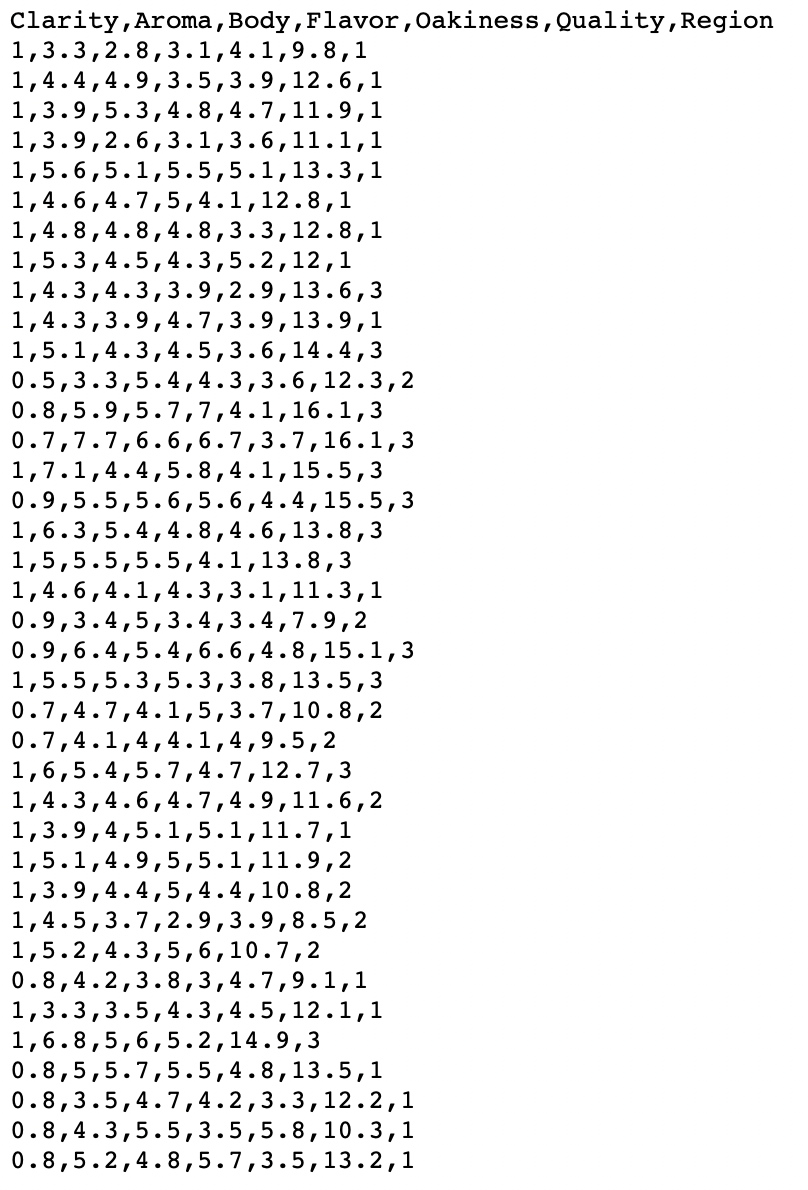
Refer to the data in Appendix B. 11 (data available on Blackboard), which gives predictors for the quality of a wine. a) (8) Construct separate scatterplots of the quality vs aroma, quality vs body, quality vs avor, and quality vs oakiness. For each of the scatterplots, state whether the predictor appears to be linearly related to the response of quality. b) (2) For the predictors in part (a) that do not appear to have a linear relationship, should we rule those variables out on the basis of the scatterplot? Why or why not? \f
Step by Step Solution
There are 3 Steps involved in it
1 Expert Approved Answer
Step: 1 Unlock

Question Has Been Solved by an Expert!
Get step-by-step solutions from verified subject matter experts
Step: 2 Unlock
Step: 3 Unlock