

Question: Thank you so much. Data Generator Select the Generate My Data button to get your unique set of data for this assignment. Price Quantity (In

Thank you so much.
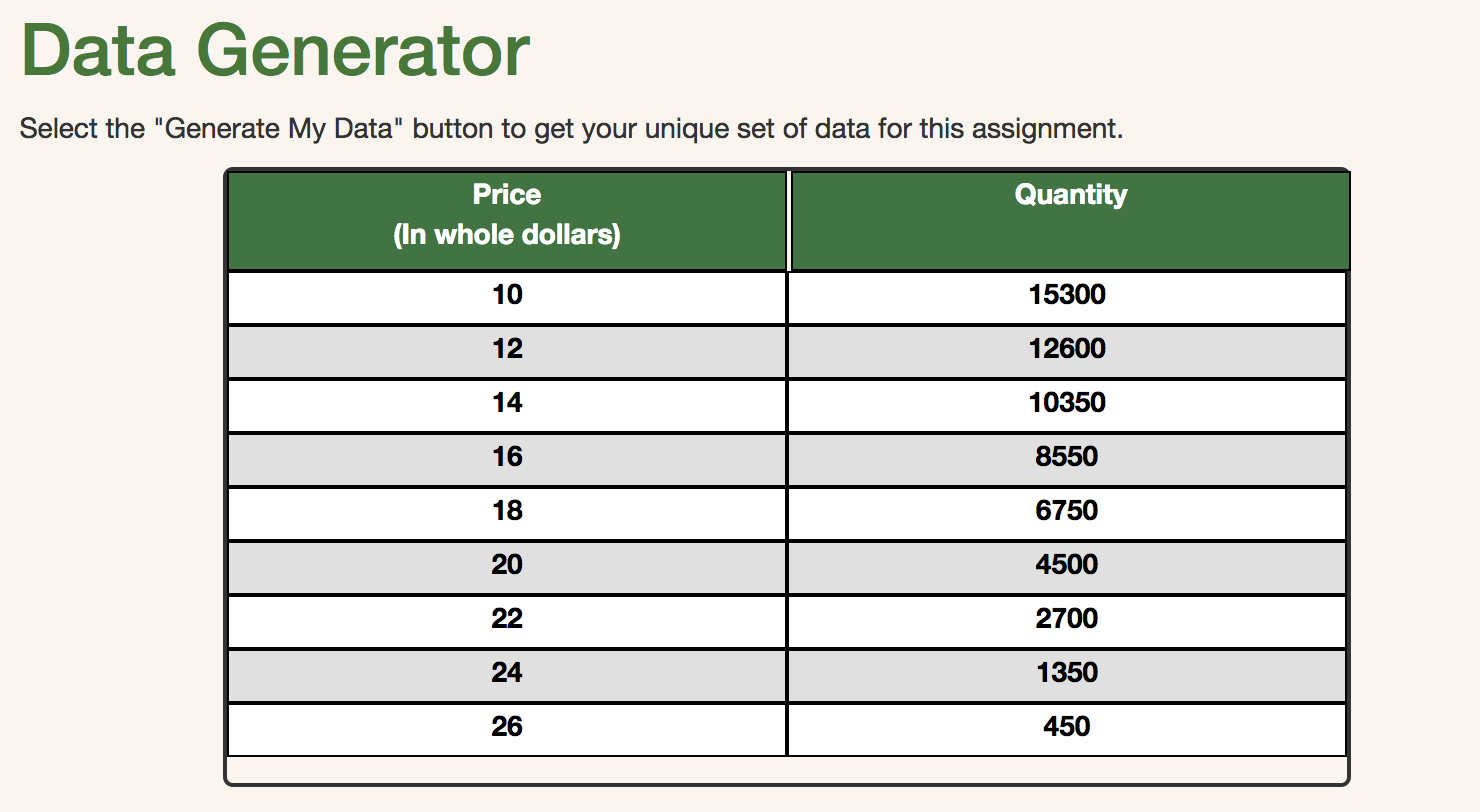

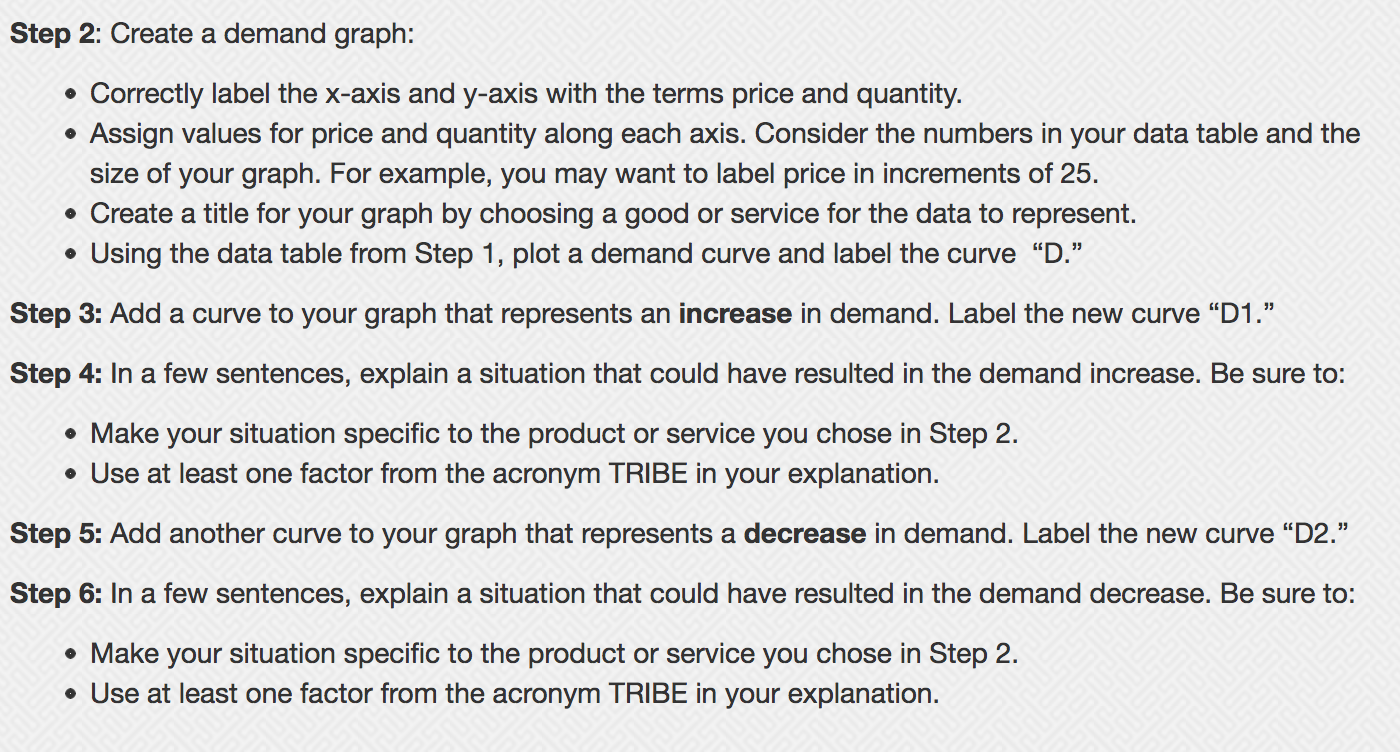
Data Generator Select the "Generate My Data" button to get your unique set of data for this assignment. Price Quantity (In whole dollars) 10 15300 12 12600 14 10350 16 8550 18 6750 20 4500 22 2700 24 1350 26 450Step 2: Create a demand graph: 0 Correctly label the x-axis and y-axis with the terms price and quantity. 0 Assign values for price and quantity along each axis. Consider the numbers in your data table and the size of your graph. For example, you may want to label price in increments of 25. 0 Create a title for your graph by choosing a good or service for the data to represent. 0 Using the data table from Step 1, plot a demand curve and label the curve "D.\" Step 3: Add a curve to your graph that represents an increase in demand. Label the new curve \"D1 ." Step 4: In a few sentences, explain a situation that could have resulted in the demand increase. Be sure to: 0 Make your situation specific to the product or service you chose in Step 2. 0 Use at least one factor from the acronym TRIBE in your explanation. Step 5: Add another curve to your graph that represents a decrease in demand. Label the new curve \"D2." Step 6: In a few sentences, explain a situation that could have resulted in the demand decrease. Be sure to: 0 Make your situation specific to the product or service you chose in Step 2. 0 Use at least one factor from the acronym TRIBE in your explanation
Step by Step Solution
There are 3 Steps involved in it

Get step-by-step solutions from verified subject matter experts