

Question: thank you so much fA sales manager collected data on annual sales for new customer accounts and the number of years of experience for a

thank you so much
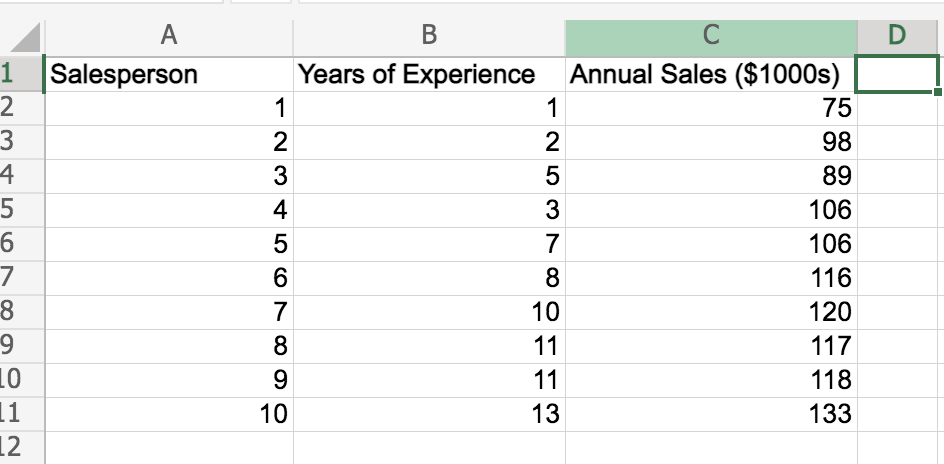
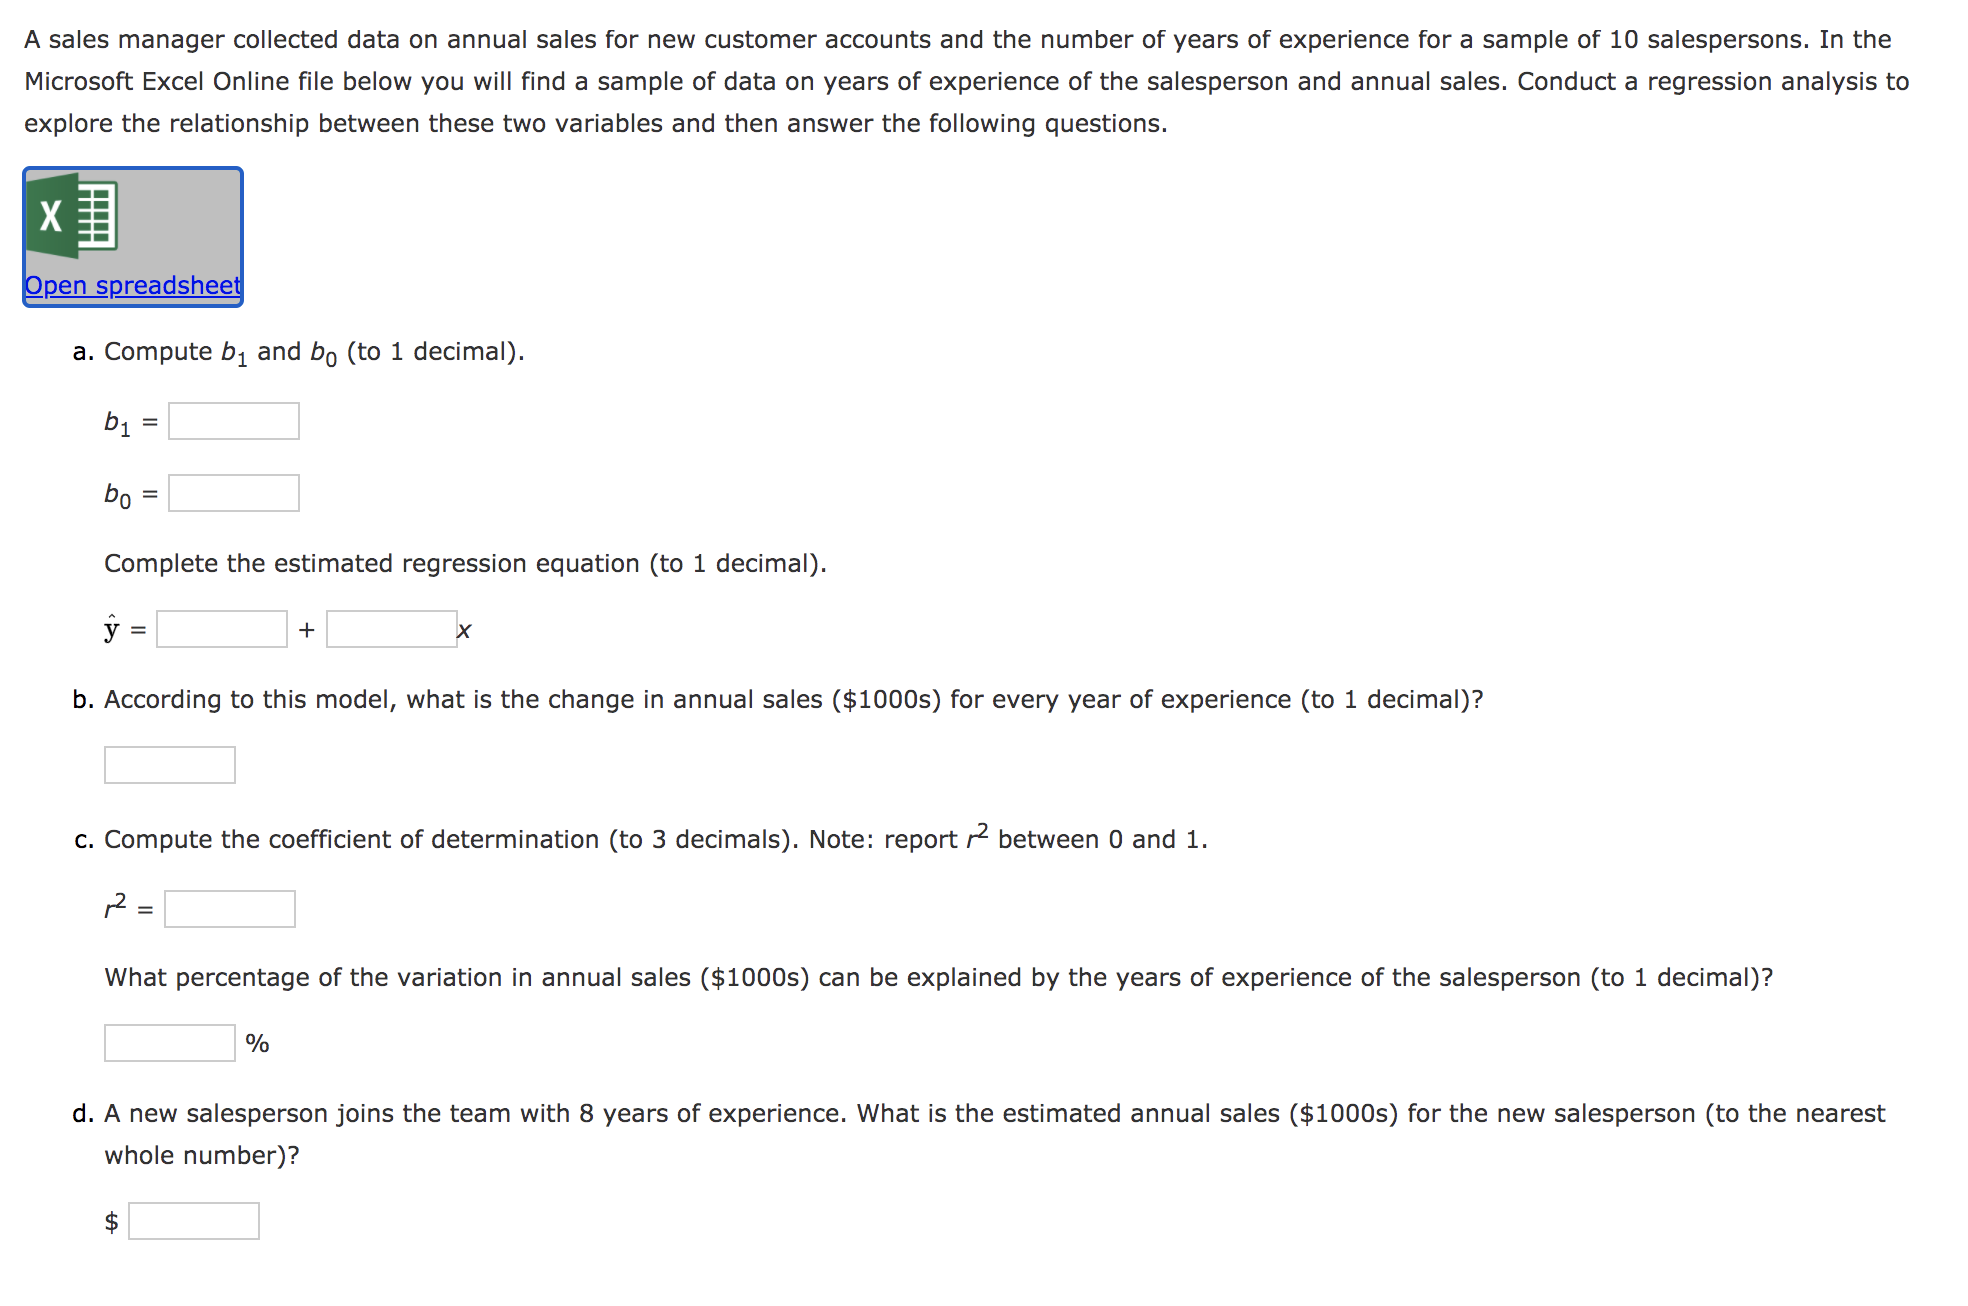
\fA sales manager collected data on annual sales for new customer accounts and the number of years of experience for a sample of 10 salespersons. In the Microsoft Excel Online le below you will nd a sample of data on years of experience of the salesperson and annual sales. Conduct a regression analysis to explore the relationship between these two variables and then answer the following questions. XE a. Compute b1 and be (to 1 decimal). b: = E be = E Complete the estimated regression equation (to 1 decimal). &=:+:lx b. According to this model, what is the change in annual sales ($10005) for every year of experience (to 1 decimal)? E c. Compute the coefcient of determination (to 3 decimals). Note: report r2 between 0 and 1. ,2: What percentage of the variation in annual sales ($10005) can be explained by the years of experience of the salesperson (to 1 decimal)? d. A new salesperson joins the team with 8 years of experience. What is the estimated annual sales ($10005) for the new salesperson (to the nearest whole number)? 1
Step by Step Solution
There are 3 Steps involved in it

Get step-by-step solutions from verified subject matter experts