

Question: thank you so much for the help! A design engineer wants to construct a sample mean chart for controlling the diameter for a component used
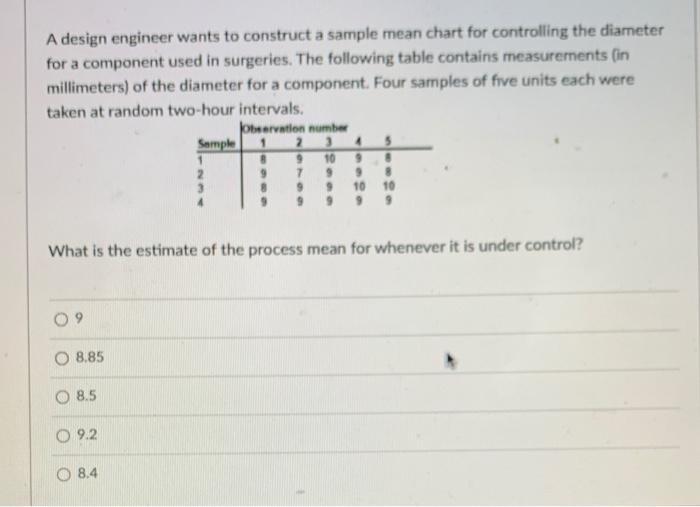
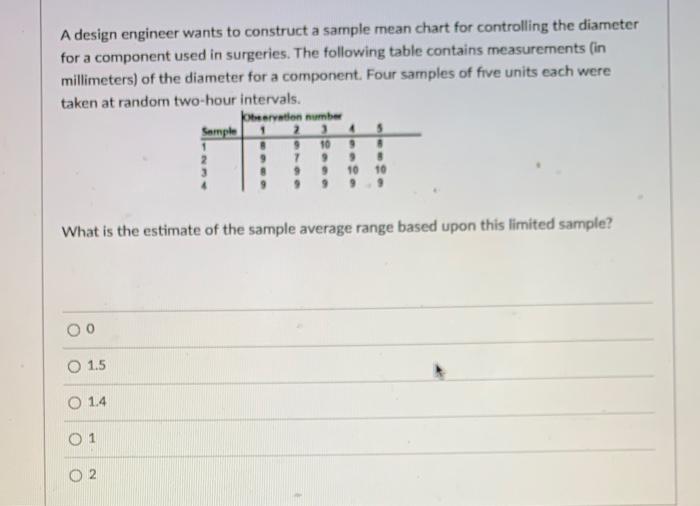
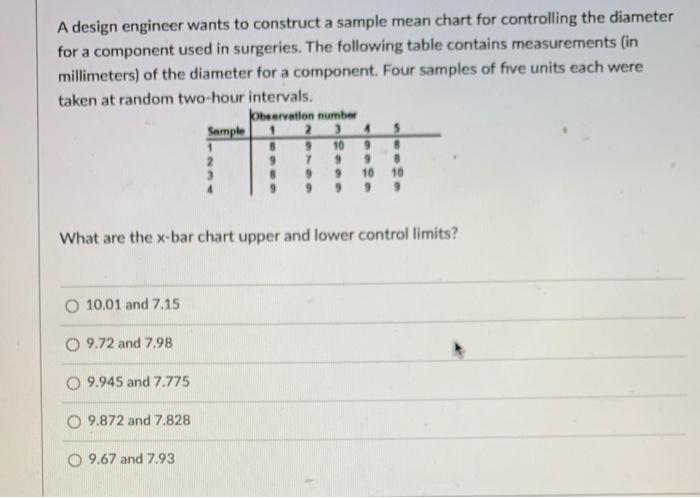
thank you so much for the help!
Step by Step Solution
There are 3 Steps involved in it
1 Expert Approved Answer
Step: 1 Unlock

Question Has Been Solved by an Expert!
Get step-by-step solutions from verified subject matter experts
Step: 2 Unlock
Step: 3 Unlock