

Question: Thank you so much. fStep 2: Create a demand graph: 0 Correctly label the x-axis and y-axis with the terms price and quantity. 0 Assign
Thank you so much.
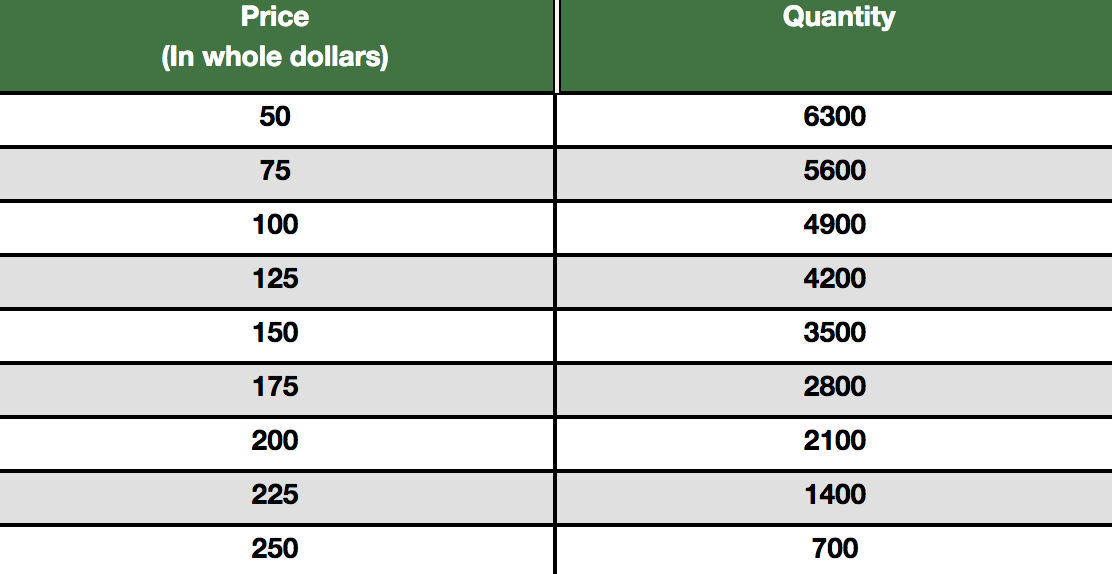
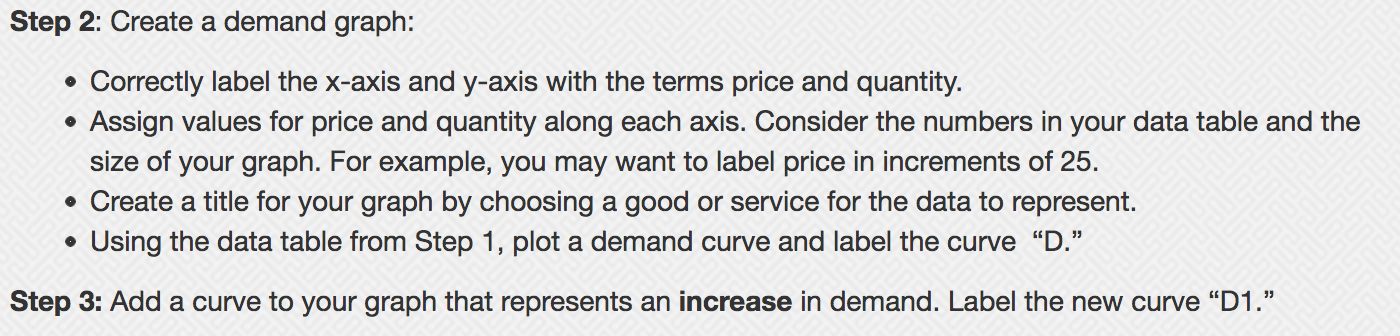
\fStep 2: Create a demand graph: 0 Correctly label the x-axis and y-axis with the terms price and quantity. 0 Assign values for price and quantity along each axis. Consider the numbers in your data table and the size of your graph. For example, you may want to label price in increments of 25. 0 Create a title for your graph by choosing a good or service for the data to represent. 0 Using the data table from Step 1, plot a demand curve and label the curve "D.\" Step 3: Add a curve to your graph that represents an increase in demand. Label the new curve \"D1 ."
Step by Step Solution
There are 3 Steps involved in it
1 Expert Approved Answer
Step: 1 Unlock

Question Has Been Solved by an Expert!
Get step-by-step solutions from verified subject matter experts
Step: 2 Unlock
Step: 3 Unlock