

Question: thanks for all the help :) 10.1.2 Table contains the value of the house and the amount of rental income in a year that the
thanks for all the help :)
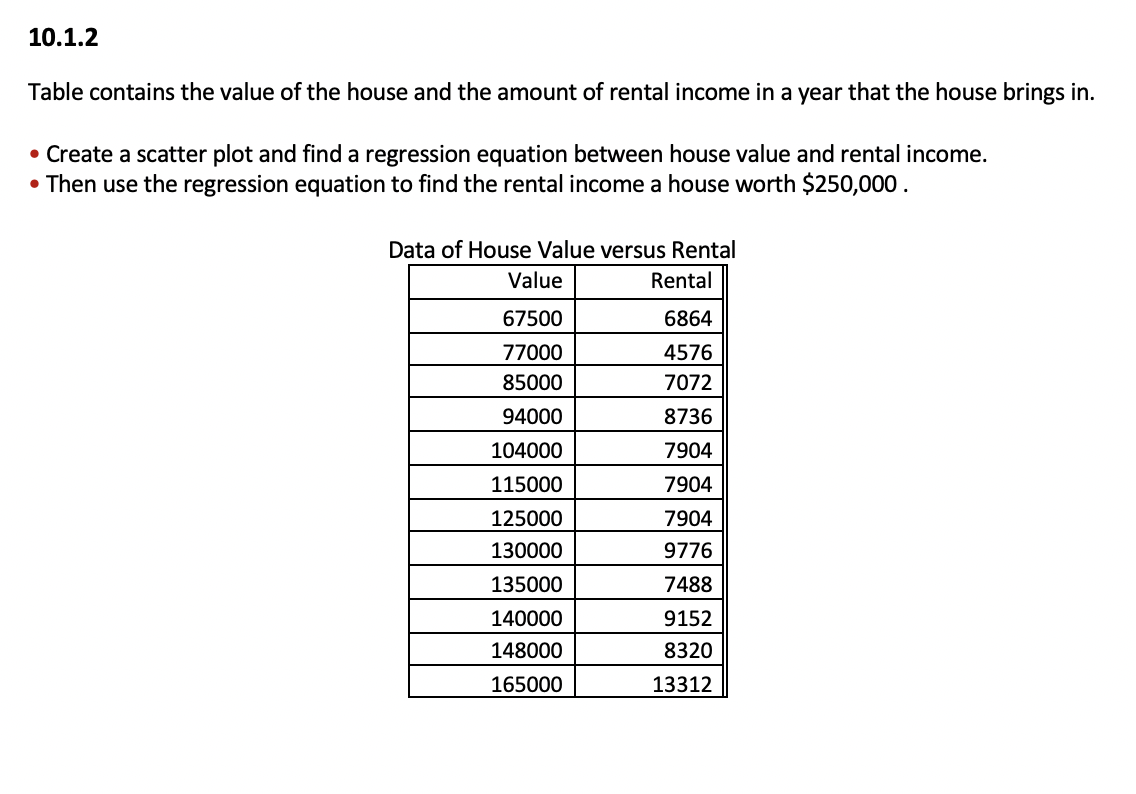
10.1.2 Table contains the value of the house and the amount of rental income in a year that the house brings in. o Create a scatter plot and find a regression equation between house value and rental income. 0 Then use the regression equation to find the rental income a house worth $250,000 . Data of House Value versus Rental value W 67500 6864 77000 4576 85000 7072 94000 8736 104000 7904 115000 7904 125000 7904 130000 9776 135000 7488 140000 9152 148000 8320 165000 13312
Step by Step Solution
There are 3 Steps involved in it
1 Expert Approved Answer
Step: 1 Unlock

Question Has Been Solved by an Expert!
Get step-by-step solutions from verified subject matter experts
Step: 2 Unlock
Step: 3 Unlock