

Question: That data interpretation. From what data can this be interpreted as ...? How do you interpret that data. From the raw data you analyze and
That data interpretation. From what data can this be interpreted as ...?
How do you interpret that data.
From the raw data you analyze and continue to be interpreted as needed
For example, for point a, identify interpretation based on pay rank, just take the top 5, based on web rank ... etc ... up to 6 interpretations
Questions:
a) Identify at least six interpretations in one or more of the data sets above.
b) Make visuals for the three interpretations (only 3 is enough).
c) Write a memo to your company/employer explaining why you chose this data and why you chose this visual to display it.
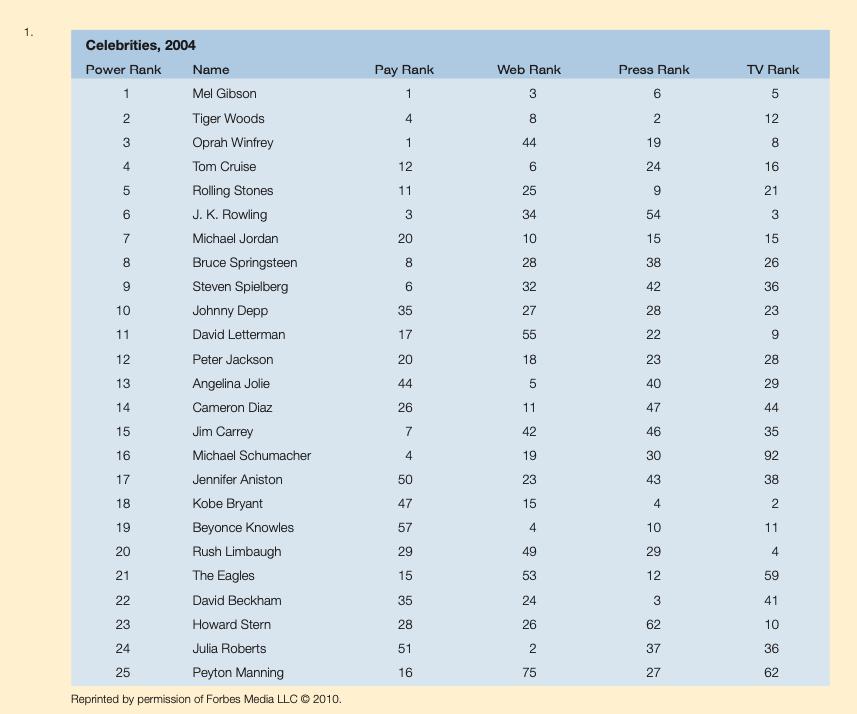
1. Celebrities, 2004 Power Rank Name Pay Rank Web Rank Press Rank TV Rank 1 Mel Gibson 1 3 5 2 Tiger Woods 2 12 3 Oprah Winfrey 1 44 19 8. 4 Tom Cruise 12 24 16 Rolling Stones 11 25 21 J. K. Rowling 3 34 54 3. 7 Michael Jordan 20 10 15 15 8. Bruce Springsteen 8 28 38 26 Steven Spielberg 6. 32 42 36 10 Johnny Depp 35 27 28 23 11 David Letterman 17 55 22 9. 12 Peter Jackson 20 18 23 28 13 Angelina Jolie 44 40 29 14 Cameron Diaz 26 11 47 44 15 Jim Carrey 42 46 35 16 Michael Schumacher 4 19 30 92 17 Jennifer Aniston 50 23 43 38 18 Kobe Bryant 47 15 4 19 Beyonce Knowles 57 10 11 20 Rush Limbaugh 29 49 29 4 21 The Eagles 15 53 12 59 22 David Beckham 35 24 41 23 Howard Stern 28 26 62 10 24 Julia Roberts 51 2 37 36 25 Peyton Manning 16 75 27 62 Reprinted by permission of Forbes Media LLC 2010.
Step by Step Solution
3.33 Rating (153 Votes )
There are 3 Steps involved in it
a Identify at least six interpretations from the data set 1 Top 5 by Pay Rank The top 5 based on pay rank are Mel Gibson Pay Rank 1 Oprah Winfrey Pay ... View full answer

Get step-by-step solutions from verified subject matter experts