

Question: that website to include in your sample. If you obtained data from a store explain where you went and how you selected the observational units
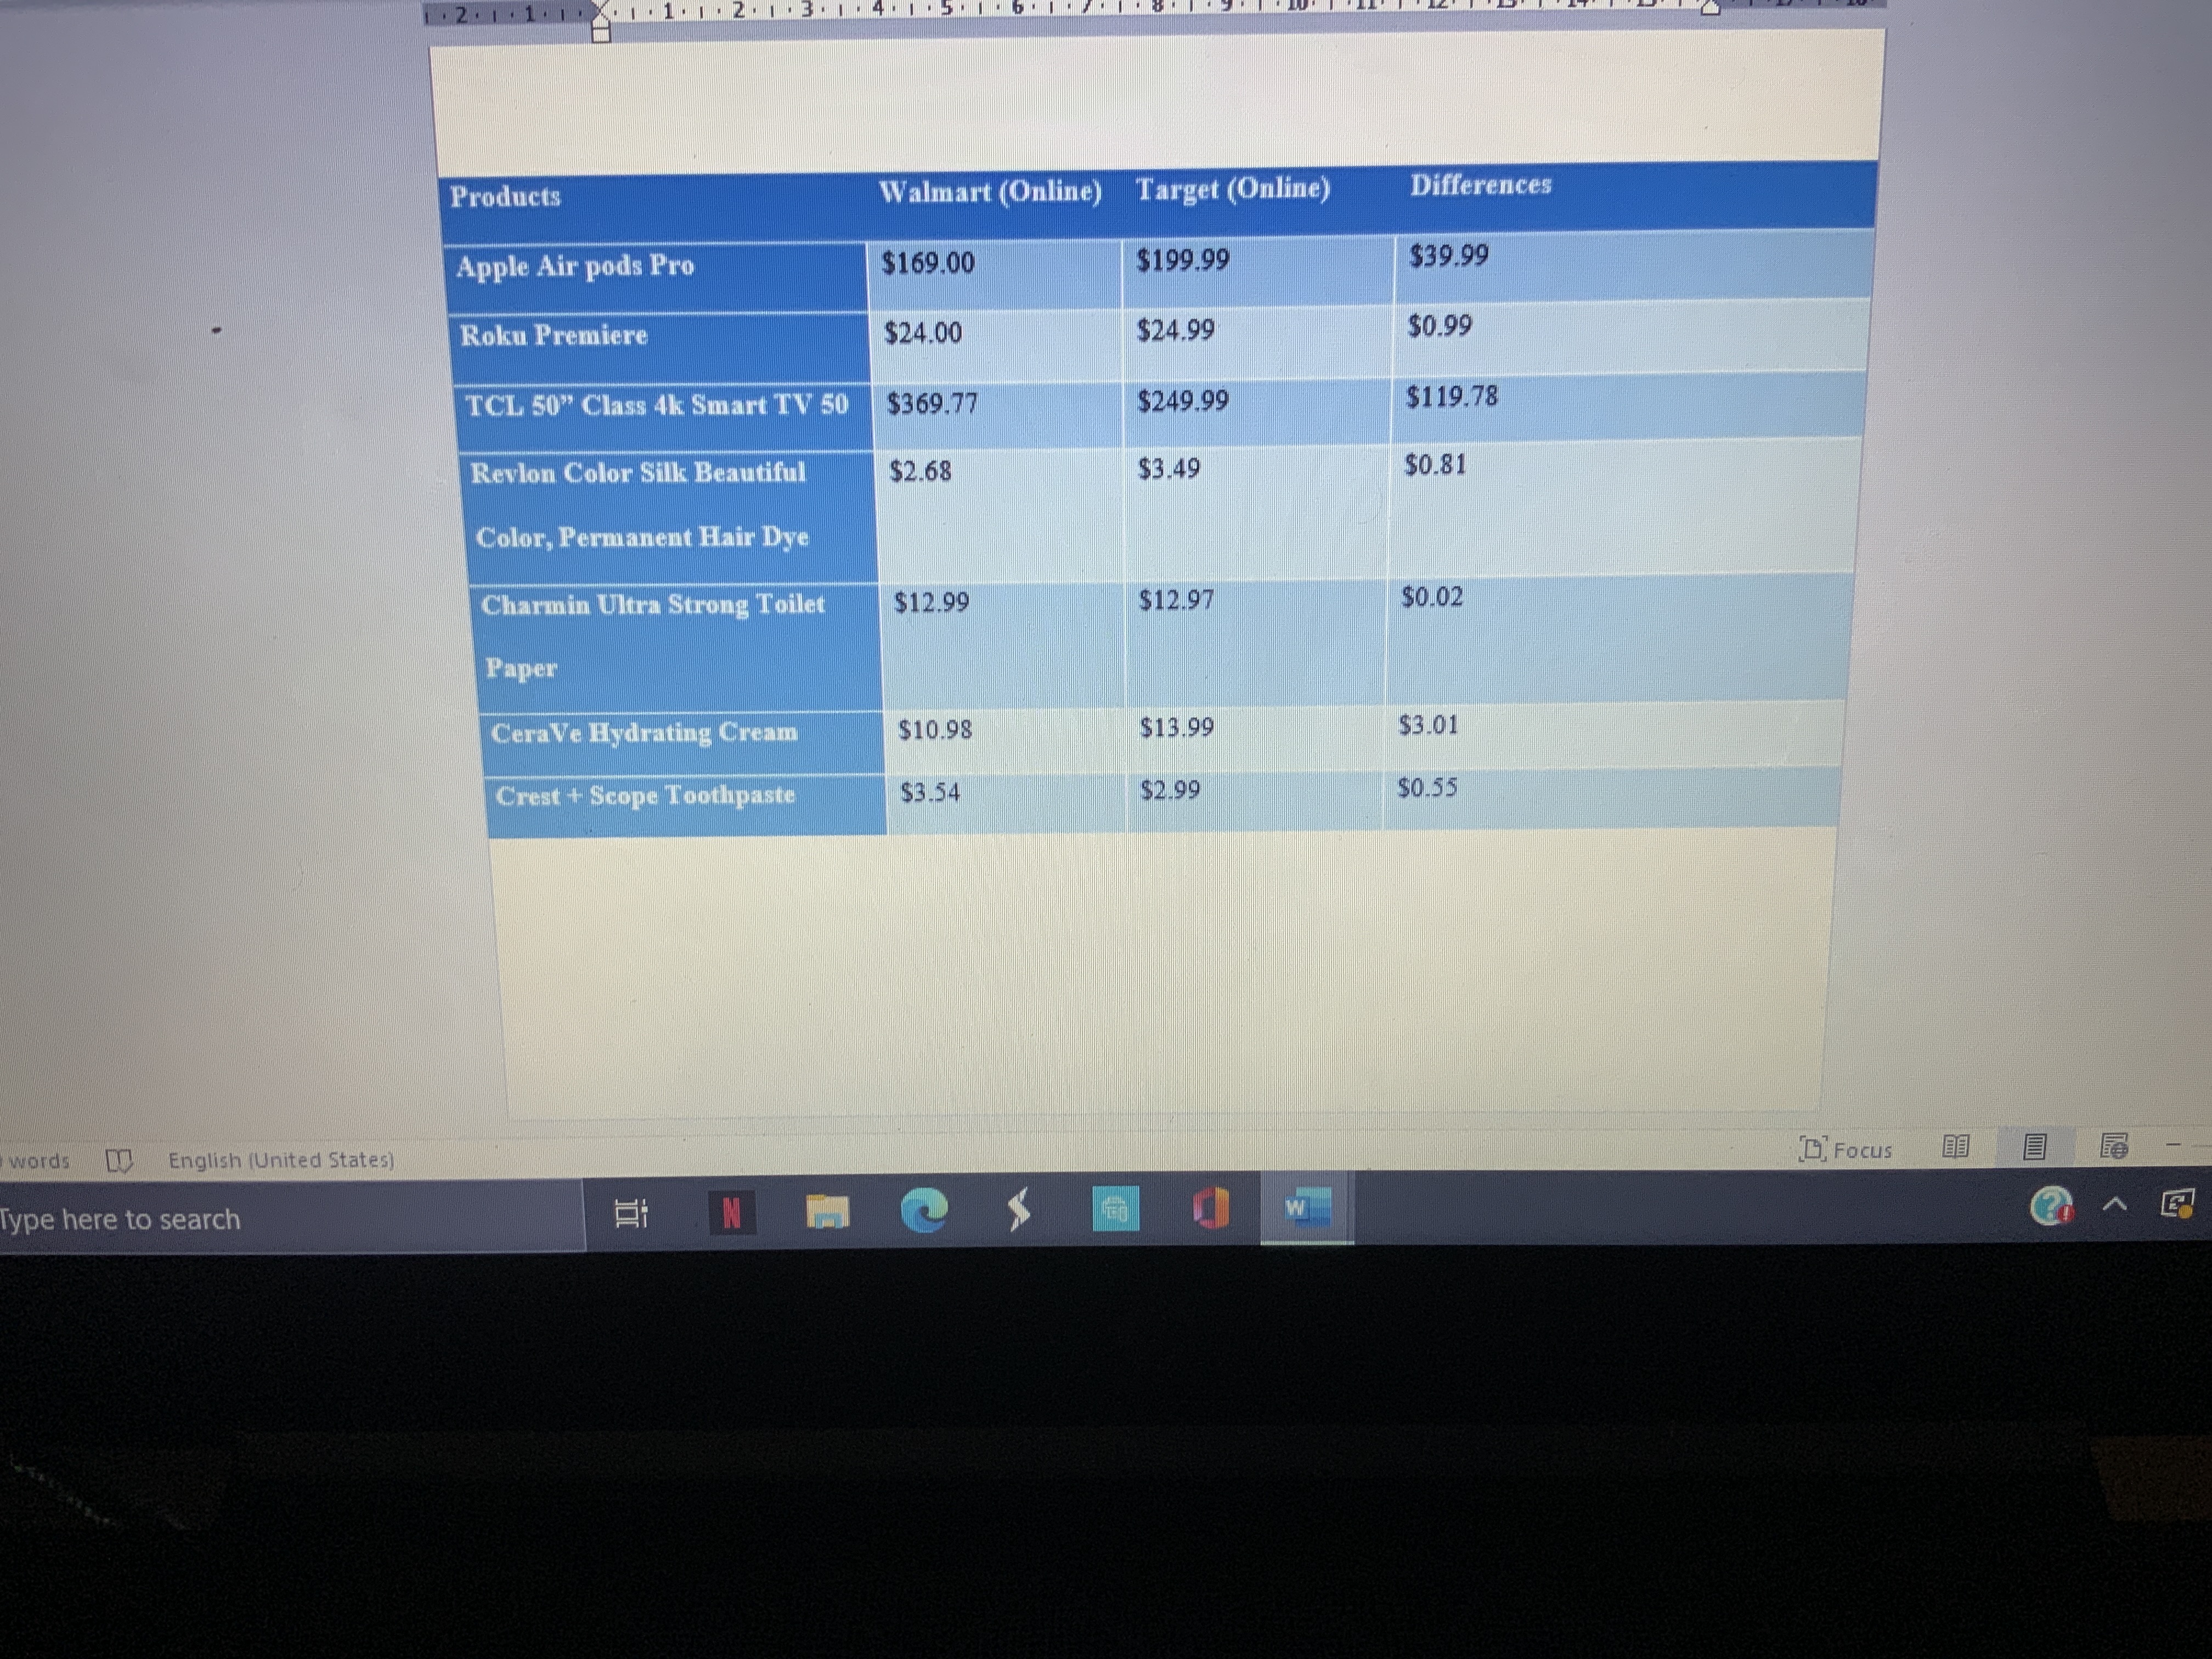
that website to include in your sample. If you obtained data from a store explain where you went and how you selected the observational units to include in your sample.. Include a table with all of your raw (not summarized) data as an appendix at the end of the report (see exercise 23-22 in your text book). . Study Design. Identify the statistical test you conducted to analyze your data. Also tell which type of design you used (one-sample, matched pairs, etc.) Give other design details (e.g., was it 1-sided or 2-sided? Left-tailed or right-tailed?) State your null and alternative hypotheses, both in words and in appropriate mathematical symbols. If you used a matched pairs design, explain clearly how the pairs of values were matched and how the difference was computed (e.g., by subtracting before after, left right, etc.) . Results: Descriptive Statistics. Give descriptive statistics for each data set. Note that t- tests for 2 independent samples will require statistics for 2 sets of data-- one for each of the two separate samples. Matched pairs t-tests will require statistics for 3 sets of data-- one for each of the 2 related values (e. g., before and after) and another one for the difference between each pair of numbers. Report each set of descriptive statistics using both a table and a chart as described below. All tables and charts should be placed directly in your report. Write a few sentences commenting on the question whether one store seems to have lower (or higher) prices than the other store. a) Table: Give sample size, mean, standard deviation, and 5-number summary b) Chart: Show a histogram that illustrates the distribution of the variable. c) Show a side-by-side box plots comparing prices between the two stores. . Results: Statistical Analysis. Report the results of your test; include the test statistic, degrees of freedom, and the p value of the signicance test. . Findings. Interpret the results in the context of your original research question. Do your analyses support your expected ndings? Explain. Interpret p-values and discuss signicance levels. Determine a 95% condence interval for the mean price difference between the two stores. . Discussion. What conclusions, if any, do you believe you can draw as a result of your study? If the results were not what you expected, what factors might explain your results? What did you learn from the project about the population(s) you studied? What did you learn about the research variable? What did you learn about the specic statistical test you conducted? What does condence interval tell you about how much you can expect to save. Collect data on the price of particular items at two local grocery stores (best) or two online stores. Example, Pricesmart vs Cost- U-Less, Pueblo vs Plaza Extra, Walmart vs Target, or Walmart vs Amazon are just some examples. Randomly choose similar or identical items in the stores in order to compare their prices. For example, carrots (10 1b bag) or Heinz Ketchup (28 oz) from both stores. Also, don't compare items which are not the same, for instance, 5 lb bag of rice with a 3 lb bag, or 2 lb bag of Rico rice with 2 lb bag of Uncle Ben's rice. From your experience in shopping at these stores, do you believe that the prices for the items in store A is cheaper, more expensive, no different than the prices in store B? The components for this project are listed in outline form below so that you can use as a checklist. However, your project is expected to be a formal paper (not an outline). Your results should be stated in complete sentences, and your paper should be written in paragraph form. Although you may choose to use headings, you should not number your paragraphs. 1. Introduction. State the topic of your study as a research question and/or as a specic hypothesis that you tested; your specic hypothesis should note a statistically signicant result that you expected to nd and the practical reason that you expected this result (your rationale). 2. Dene Population(s). Dene clearly the population(s) that you intend for your study to represent. 3. Dene Variable(s). Dene clearly the variable(s) that you obtained during your data collection 4. Data Collection. Describe your data collection process and sampling strategy. If you located data on a website, provide the URL and tell how you selected observational units from that website to include in your sample. If you obtained data from a store explain where you went and how you selected the observational units to include in your sample. Include a table with all of your raw (not summarized) data as an appendix at the end of the report (see exercise 23-22 in your text book). 4. Study Design. Identify the statistical test you conducted to analyze your data. Also tell which type of design you used (one-sample, matched pairs, etc.) Give other design details (e.g., was it l-sided or 2-sided? Left-tailed or right-tailed?) State your null and alternative hypotheses, both in words and in appropriate mathematical symbols. If you used a matched pairs design, explain clearly how the pairs of values were matched and how the difference was computed (e.g., by subtracting before after, left right, etc.) 5. Results: Descriptive Statistics. Give descriptive statistics for each data set. Note that t- tests for 2 independent samples will require statistics for 2 sets of data-- one for each of the two separate samples. Matched pairs t-tests will require statistics for 3 sets of data-- one for each of the 2 related values (e.g., before and after) and another one for the difference between each pair of numbers. Report each set of descriptive statistics using both a table and a chart as described below. All tables and charts should be placed directly in your report. Write a few sentences cementing on the question whether one store seems to have lower (or higher) prices than the other store. 12 1 1 1 1. 1 : 2 . 1 . 3 . Products Walmart (Online) Target (Online) Differences Apple Air pods Pro $169.00 $199.99 $39.99 Roku Premiere $24.00 $24.99 $0.99 TCL 50" Class 4k Smart TV 50 $369.77 $249.99 $119.78 Revlon Color Silk Beautiful $2.68 $3.49 $0.81 Color, Permanent Hair Dye Charmin Ultra Strong Toilet $12.99 $12.97 $0.02 Paper CeraVe Hydrating Cream $10.98 $13.99 $3.01 Crest + Scope Toothpaste $3.54 $2.9 $0.55 words English (United States) Focus Type here to search
Step by Step Solution
There are 3 Steps involved in it

Get step-by-step solutions from verified subject matter experts