

Question: thats the full problem Question 4 (15 points). Suppose the current 1-year interest rate is 5%. Part A) Assume that the l-year interest rate is
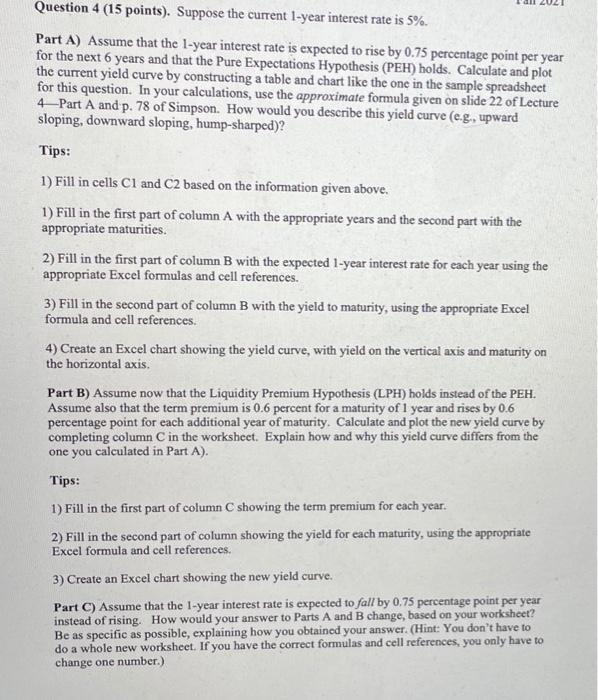
Question 4 (15 points). Suppose the current 1-year interest rate is 5%. Part A) Assume that the l-year interest rate is expected to rise by 0.75 percentage point per year for the next 6 years and that the Pure Expectations Hypothesis (PEH) holds. Calculate and plot the current yield curve by constructing a table and chart like the one in the sample spreadsheet for this question. In your calculations, use the approximate formula given on slide 22 of Lecture 4Part A and p. 78 of Simpson. How would you describe this yield curve (e.g, upward sloping, downward sloping, hump-sharped)? Tips: 1) Fill in cells C1 and C2 based on the information given above. 1) Fill in the first part of column A with the appropriate years and the second part with the appropriate maturities. 2) Fill in the first part of column B with the expected 1-year interest rate for each year using the appropriate Excel formulas and cell references. 3) Fill in the second part of column B with the yield to maturity, using the appropriate Excel formula and cell references. 4) Create an Excel chart showing the yield curve, with yield on the vertical axis and maturity on the horizontal axis. Part B) Assume now that the Liquidity Premium Hypothesis (LPH) holds instead of the PEH. Assume also that the term premium is 0.6 percent for a maturity of 1 year and rises by 0.6 percentage point for each additional year of maturity. Calculate and plot the new yield curve by completing column C in the worksheet. Explain how and why this yield curve differs from the one you calculated in Part A). Tips: 1) Fill in the first part of column C showing the term premium for each year. 2) Fill in the second part of column showing the yield for each maturity, using the appropriate Excel formula and cell references. 3) Create an Excel chart showing the new yield curve. Part C) Assume that the 1-year interest rate is expected to fall by 0.75 percentage point per year instead of rising. How would your answer to Parts A and B change, based on your worksheet? Be as specific as possible, explaining how you obtained your answer. (Hint: You don't have to and cell references, you only have to do a whole new worksheet. If you have the correct form change one number.) Part D). What lessons can you draw from this problem about the relationship between interest rate expectations and the slope of the yield curve under the two alternative theories of the term structure (PEH and LPH)? Question 4 (15 points). Suppose the current 1-year interest rate is 5%. Part A) Assume that the l-year interest rate is expected to rise by 0.75 percentage point per year for the next 6 years and that the Pure Expectations Hypothesis (PEH) holds. Calculate and plot the current yield curve by constructing a table and chart like the one in the sample spreadsheet for this question. In your calculations, use the approximate formula given on slide 22 of Lecture 4Part A and p. 78 of Simpson. How would you describe this yield curve (e.g, upward sloping, downward sloping, hump-sharped)? Tips: 1) Fill in cells C1 and C2 based on the information given above. 1) Fill in the first part of column A with the appropriate years and the second part with the appropriate maturities. 2) Fill in the first part of column B with the expected 1-year interest rate for each year using the appropriate Excel formulas and cell references. 3) Fill in the second part of column B with the yield to maturity, using the appropriate Excel formula and cell references. 4) Create an Excel chart showing the yield curve, with yield on the vertical axis and maturity on the horizontal axis. Part B) Assume now that the Liquidity Premium Hypothesis (LPH) holds instead of the PEH. Assume also that the term premium is 0.6 percent for a maturity of 1 year and rises by 0.6 percentage point for each additional year of maturity. Calculate and plot the new yield curve by completing column C in the worksheet. Explain how and why this yield curve differs from the one you calculated in Part A). Tips: 1) Fill in the first part of column C showing the term premium for each year. 2) Fill in the second part of column showing the yield for each maturity, using the appropriate Excel formula and cell references. 3) Create an Excel chart showing the new yield curve. Part C) Assume that the 1-year interest rate is expected to fall by 0.75 percentage point per year instead of rising. How would your answer to Parts A and B change, based on your worksheet? Be as specific as possible, explaining how you obtained your answer. (Hint: You don't have to and cell references, you only have to do a whole new worksheet. If you have the correct form change one number.) Part D). What lessons can you draw from this problem about the relationship between interest rate expectations and the slope of the yield curve under the two alternative theories of the term structure (PEH and LPH)
Step by Step Solution
There are 3 Steps involved in it

Get step-by-step solutions from verified subject matter experts