

Question: . The 1 Hiring Data Table con Breid fing sa numb w tal F 20 add on. Hon. is suff sufficie thos Explain om the
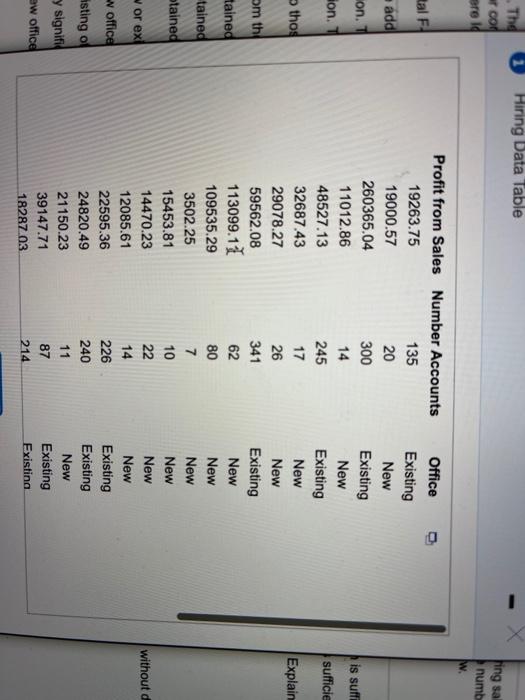
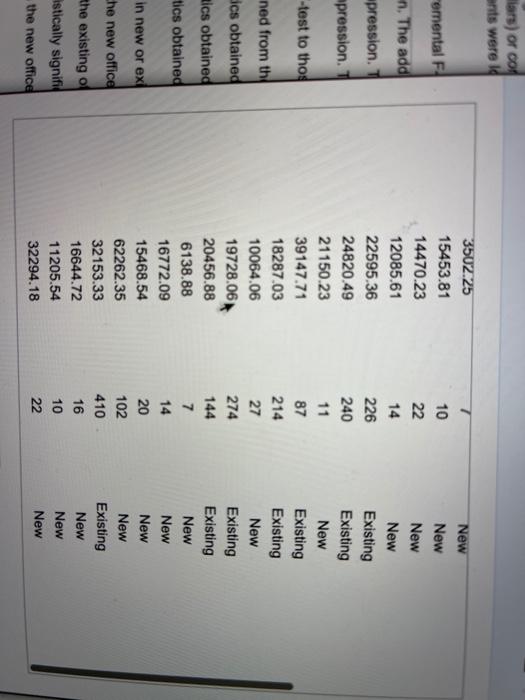
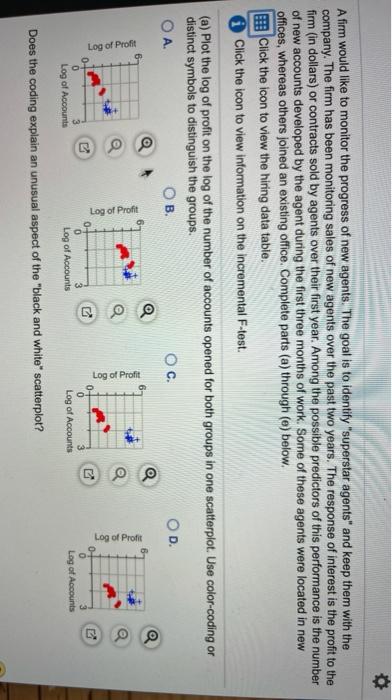
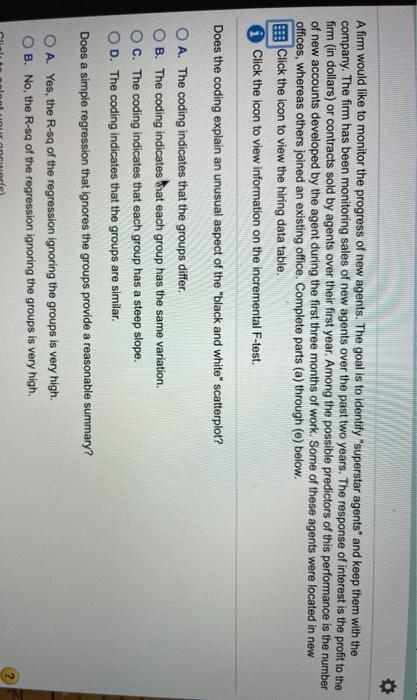
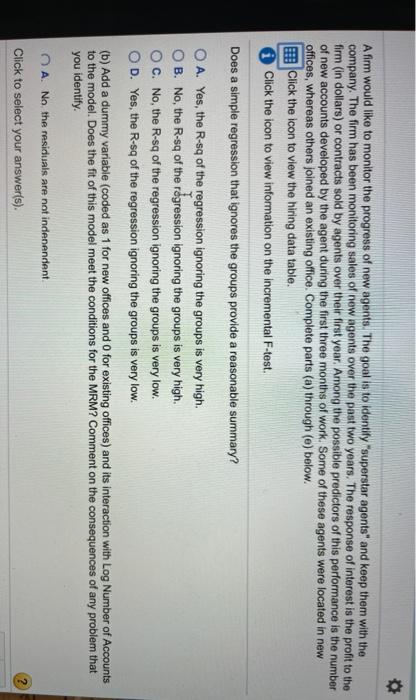

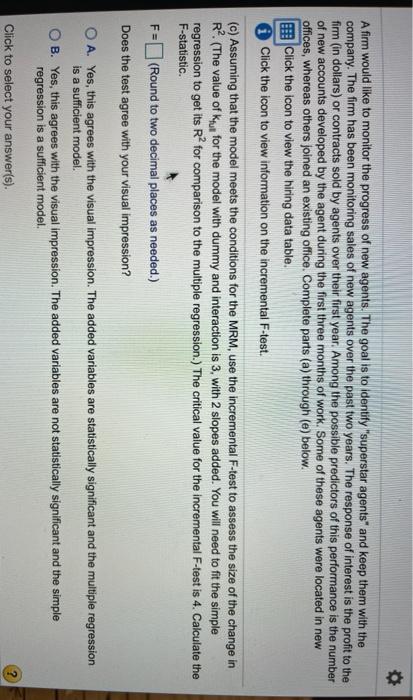

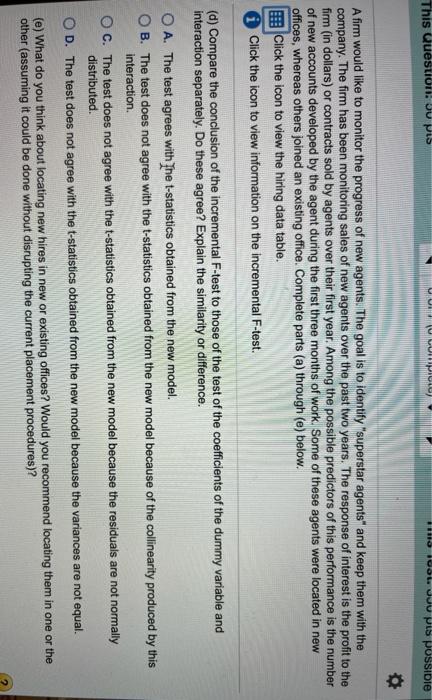

. The 1 Hiring Data Table con Breid fing sa numb w tal F 20 add on. Hon. is suff sufficie thos Explain om the tained Profit from Sales Number Accounts 19263.75 135 19000.57 260365.04 300 11012.86 14 48527.13 245 32687.43 17 29078.27 26 59562.08 341 113099.11 109535.29 80 3502.25 7 15453.81 10 14470.23 22 12085.61 14 22595.36 226 24820.49 240 21150.23 11 39147.71 87 1828703 214 62 Office Existing New Existing New Existing New New Existing New New New New New New Existing Existing New Existing Existina tained btained without d w or ex w office isting of y signifi ew office lars) or con ants were id 7 emental FL 10 n. The add pression. mpression -test to thos ned from the 3502.25 15453.81 14470.23 12085.61 22595.36 24820.49 21150.23 39147.71 18287.03 10064.06 19728.06 20456.88 6138.88 16772.09 15468.54 62262.35 32153.33 16644.72 11205.54 32294.18 22 14 226 240 11 87 214 27 274 144 7 14 20 102 410 16 New New New New Existing Existing New Existing Existing New Existing Existing New New New New Existing New New New dics obtained Rics obtained tics obtained in new or ex he new office the existing of astically signifi the new office 10 22 A firm would like to monitor the progress of new agents. The goal is to identify "superstar agents" and keep them with the company. The firm has been monitoring sales of new agents over the past two years. The response of interest is the profit to the firm (in dollars) or contracts sold by agents over their first year. Among the possible predictors of this performance is the number of new accounts developed by the agent during the first three months of work. Some of these agents were located in new offices, whereas others joined an existing office. Complete parts (a) through (e) below. Click the icon to view the hiring data table. Click the icon to view information on the incremental F-test. (a) Plot the log of profit on the log of the number of accounts opened for both groups in one scatterplot. Use color-coding or distinct symbols to distinguish the groups. OA. OB Oc. OD. Q Log of Profit Log of Profit Log of Profit o Log of Profit 0 Log of Accounts Log of Accounts Lag of Accounts Log of Accounts Does the coding explain an unusual aspect of the "black and white" scatterplot? A firm would like to monitor the progress of new agents. The goal is to identify "superstar agents" and keep them with the company. The firm has been monitoring sales of new agents over the past two years. The response of interest is the profit to the firm (in dollars) or contracts sold by agents over their first year. Among the possible predictors of this performance is the number of new accounts developed by the agent during the first three months of work. Some of these agents were located in new offices, whereas others joined an existing office. Complete parts (a) through (e) below. Click the icon to view the hiring data table. Click the icon to view information on the incremental F-test. Does the coding explain an unusual aspect of the "black and white" scatterplot? O A. The coding indicates that the groups differ. B. The coding indicates that each group has the same variation. C. The coding indicates that each group has a steep slope. D. The coding indicates that the groups are similar. Does a simple regression that ignores the groups provide a reasonable summary? A. Yes, the R-s of the regression ignoring the groups is very high. B. No, the R-sg of the regression ignoring the groups is very high. A firm would like to monitor the progress of new agents. The goal is to identity "superstar agents" and keep them with the company. The firm has been monitoring sales of new agents over the past two years. The response of interest is the profit to the firm (in dollars) or contracts sold by agents over their first year. Among the possible predictors of this performance is the number of new accounts developed by the agent during the first three months of work. Some of these agents were located in new offices, whereas others joined an existing office. Complete parts (a) through (e) below. Click the icon to view the hiring data table. i Click the icon to view information on the incremental F-test. Does a simple regression that ignores the groups provide a reasonable summary? O A. Yes, the R-sg of the regression ignoring the groups is very high. B. No, the R-sqof the regression ignoring the groups is very high. OC. No, the R-sq of the regression ignoring the groups is very low. D. Yes, the R-sg of the regression ignoring the groups is very low. (b) Add a dummy variable (coded as 1 for new offices and 0 for existing offices) and its interaction with Log Number of Accounts to the model. Does the fit of this model meet the conditions for the MRM? Comment on the consequences of any problem that you identify A. No the residuals are not independent Click to select your answer(s). 2 A firm would like to monitor the progress of new agents. The goal is to identify "superstar agents" and keep them with the company. The firm has been monitoring sales of new agents over the past two years. The response of interest is the profit to the firm (in dollars) or contracts sold by agents over their first year. Among the possible predictors of this performance is the number of new accounts developed by the agent during the first three months of work. Some of these agents were located in new offices, whereas others joined an existing office. Complete parts (a) through (e) below. Click the icon to view the hiring data table. Click the icon to view information on the incremental F-test. (b) Add a dummy variable (coded as 1 for new offices and 0 for existing offices) and its interaction with Log Number of Accounts to the model. Does the fit of this model meet the conditions for the MRM? Comment on the consequences of any problem that you identify O A. No, the residuals are Not independent. B. This model does not meet all of the conditions of the MRM because there is a dummy variables in the model OC. No, because there is not a linear association between the log of accounts and log of profit for each group. D. The model meets all of the conditions of the MRM because there are no flaws. (c) Assuming that the model meets the conditions for the MRM, use the incremental F-test to assess the size of the change in R? (The value of kun for the model with dummy and interaction is 3, with 2 slopes added. You will need to fit the simple rearession to get its R for comparison to the multiple rearession. The critical value for the incremental F-test is 4. Calculate the Click to select your answer(s). A firm would like to monitor the progress of new agents. The goal is to identify "superstar agents and keep them with the company. The firm has been monitoring sales of new agents over the past two years. The response of interest is the profit to the firm (in dollars) or contracts sold by agents over their first year. Among the possible predictors of this performance is the number of new accounts developed by the agent during the first three months of work. Some of these agents were located in new offices, whereas others joined an existing office. Complete parts (a) through (e) below. Click the icon to view the hiring data table. Click the icon to view information on the incremental F-test. (c) Assuming that the model meets the conditions for the MRM, use the incremental F-test to assess the size of the change in R?. (The value of kun for the model with dummy and interaction is 3, with 2 slopes added. You will need to fit the simple regression to get its R for comparison to the multiple regression.) The critical value for the incremental F-test is 4. Calculate the F-statistic. - (Round to two decimal places as needed.) Does the test agree with your visual impression? F= OA. Yes, this agrees with the visual impression. The added variables are statistically significant and the multiple regression is a sufficient model. B. Yes, this agrees with the visual impression. The added variables are not statistically significant and the simple regression is a sufficient model. Click to select your answer(s). A firm would like to monitor the progress of new agents. The goal is to identify "superstar agents" and keep them with the company. The firm has been monitoring sales of new agents over the past two years. The response of interest is the profit to the firm (in dollars) or contracts sold by agents over their first year. Among the possible predictors of this performance is the number of new accounts developed by the agent during the first three months of work. Some of these agents were located in new offices, whereas others joined an existing office. Complete parts (a) through (e) below. Click the icon to view the hiring data table. i Click the icon to view information on the incremental F-test. Does the test agree with your visual impression? O A. Yes, this agrees with the visual impression. The added variables are statistically significant and the multiple regression is a sufficient model. B. Yes, this agrees with the visual impression. The added variables are not statistically significant and the simple regression is a sufficient model. O C. No, this does not agree with the visual impression. This test indicates that the added variables are not statistically significant and the simple regression is sufficient. OD. No, this does not agree with the visual impression. This test indicates that the added variables are statistically significant and the multiple regression is sufficient. (d) Compare the conclusion of the incremental F-test to those of the test of the coefficients of the dummy variable and This Question. Ju pis WA MAIS **115 Ul. Jou pis possible Afirm would like to monitor the progress of new agents. The goal is to identify "superstar agents" and keep them with the company. The firm has been monitoring sales of new agents over the past two years. The response of interest is the profit to the firm (in dollars) or contracts sold by agents over their first year. Among the possible predictors of this performance is the number of new accounts developed by the agent during the first three months of work. Some of these agents were located in new offices, whereas others joined an existing office. Complete parts (a) through (e) below. Click the icon to view the hiring data table. Click the icon to view information on the incremental F-test. (d) Compare the conclusion of the incremental F-test to those of the test of the coefficients of the dummy variable and interaction separately. Do these agree? Explain the similarity or difference. O A. The test agrees with The t-statistics obtained from the new model. OB. The test does not agree with the t-statistics obtained from the new model because of the collinearity produced by this interaction O C. The test does not agree with the t-statistics obtained from the new model because the residuals are not normally distributed OD. The test does not agree with the t-statistics obtained from the new model because the variances are not equal. (e) What do you think about locating new hires in new or existing offices? Would you recommend locating them in one or the other (assuming it could be done without disrupting the current placement procedures)? A firm would like to monitor the progress of new agents. The goal is to identify "superstar agents" and keep them with the company. The firm has been monitoring sales of new agents over the past two years. The response of interest is the profit to the firm (in dollars) or contracts sold by agents over their first year. Among the possible predictors of this performance is the number of new accounts developed by the agent during the first three months of work. Some of these agents were located in new offices, whereas others joined an existing office. Complete parts (a) through (e) below. Click the icon to view the hiring data table. i Click the icon to view information on the incremental F-test. . (e) What do you think about locating new hires in new or existing offices? Would you recommend locating them in one or the other (assuming it could be done without disrupting the current placement procedures)? O A. Recommend locating the new hires in the new offices because it is shown that new hires in the new offices result in higher profits. B. Recommend locating the new hires in the existing offices because it is shown that new hires in the existing offices result in higher profits. OC. Since the added variables are not statistically significant, location of the new hires in either a new or existing office is not important. D. Recommend locating the new hires in the new offices because it is shown that new hires in the new offices result in lower variance of profits. Click to select your answer(s). . The 1 Hiring Data Table con Breid fing sa numb w tal F 20 add on. Hon. is suff sufficie thos Explain om the tained Profit from Sales Number Accounts 19263.75 135 19000.57 260365.04 300 11012.86 14 48527.13 245 32687.43 17 29078.27 26 59562.08 341 113099.11 109535.29 80 3502.25 7 15453.81 10 14470.23 22 12085.61 14 22595.36 226 24820.49 240 21150.23 11 39147.71 87 1828703 214 62 Office Existing New Existing New Existing New New Existing New New New New New New Existing Existing New Existing Existina tained btained without d w or ex w office isting of y signifi ew office lars) or con ants were id 7 emental FL 10 n. The add pression. mpression -test to thos ned from the 3502.25 15453.81 14470.23 12085.61 22595.36 24820.49 21150.23 39147.71 18287.03 10064.06 19728.06 20456.88 6138.88 16772.09 15468.54 62262.35 32153.33 16644.72 11205.54 32294.18 22 14 226 240 11 87 214 27 274 144 7 14 20 102 410 16 New New New New Existing Existing New Existing Existing New Existing Existing New New New New Existing New New New dics obtained Rics obtained tics obtained in new or ex he new office the existing of astically signifi the new office 10 22 A firm would like to monitor the progress of new agents. The goal is to identify "superstar agents" and keep them with the company. The firm has been monitoring sales of new agents over the past two years. The response of interest is the profit to the firm (in dollars) or contracts sold by agents over their first year. Among the possible predictors of this performance is the number of new accounts developed by the agent during the first three months of work. Some of these agents were located in new offices, whereas others joined an existing office. Complete parts (a) through (e) below. Click the icon to view the hiring data table. Click the icon to view information on the incremental F-test. (a) Plot the log of profit on the log of the number of accounts opened for both groups in one scatterplot. Use color-coding or distinct symbols to distinguish the groups. OA. OB Oc. OD. Q Log of Profit Log of Profit Log of Profit o Log of Profit 0 Log of Accounts Log of Accounts Lag of Accounts Log of Accounts Does the coding explain an unusual aspect of the "black and white" scatterplot? A firm would like to monitor the progress of new agents. The goal is to identify "superstar agents" and keep them with the company. The firm has been monitoring sales of new agents over the past two years. The response of interest is the profit to the firm (in dollars) or contracts sold by agents over their first year. Among the possible predictors of this performance is the number of new accounts developed by the agent during the first three months of work. Some of these agents were located in new offices, whereas others joined an existing office. Complete parts (a) through (e) below. Click the icon to view the hiring data table. Click the icon to view information on the incremental F-test. Does the coding explain an unusual aspect of the "black and white" scatterplot? O A. The coding indicates that the groups differ. B. The coding indicates that each group has the same variation. C. The coding indicates that each group has a steep slope. D. The coding indicates that the groups are similar. Does a simple regression that ignores the groups provide a reasonable summary? A. Yes, the R-s of the regression ignoring the groups is very high. B. No, the R-sg of the regression ignoring the groups is very high. A firm would like to monitor the progress of new agents. The goal is to identity "superstar agents" and keep them with the company. The firm has been monitoring sales of new agents over the past two years. The response of interest is the profit to the firm (in dollars) or contracts sold by agents over their first year. Among the possible predictors of this performance is the number of new accounts developed by the agent during the first three months of work. Some of these agents were located in new offices, whereas others joined an existing office. Complete parts (a) through (e) below. Click the icon to view the hiring data table. i Click the icon to view information on the incremental F-test. Does a simple regression that ignores the groups provide a reasonable summary? O A. Yes, the R-sg of the regression ignoring the groups is very high. B. No, the R-sqof the regression ignoring the groups is very high. OC. No, the R-sq of the regression ignoring the groups is very low. D. Yes, the R-sg of the regression ignoring the groups is very low. (b) Add a dummy variable (coded as 1 for new offices and 0 for existing offices) and its interaction with Log Number of Accounts to the model. Does the fit of this model meet the conditions for the MRM? Comment on the consequences of any problem that you identify A. No the residuals are not independent Click to select your answer(s). 2 A firm would like to monitor the progress of new agents. The goal is to identify "superstar agents" and keep them with the company. The firm has been monitoring sales of new agents over the past two years. The response of interest is the profit to the firm (in dollars) or contracts sold by agents over their first year. Among the possible predictors of this performance is the number of new accounts developed by the agent during the first three months of work. Some of these agents were located in new offices, whereas others joined an existing office. Complete parts (a) through (e) below. Click the icon to view the hiring data table. Click the icon to view information on the incremental F-test. (b) Add a dummy variable (coded as 1 for new offices and 0 for existing offices) and its interaction with Log Number of Accounts to the model. Does the fit of this model meet the conditions for the MRM? Comment on the consequences of any problem that you identify O A. No, the residuals are Not independent. B. This model does not meet all of the conditions of the MRM because there is a dummy variables in the model OC. No, because there is not a linear association between the log of accounts and log of profit for each group. D. The model meets all of the conditions of the MRM because there are no flaws. (c) Assuming that the model meets the conditions for the MRM, use the incremental F-test to assess the size of the change in R? (The value of kun for the model with dummy and interaction is 3, with 2 slopes added. You will need to fit the simple rearession to get its R for comparison to the multiple rearession. The critical value for the incremental F-test is 4. Calculate the Click to select your answer(s). A firm would like to monitor the progress of new agents. The goal is to identify "superstar agents and keep them with the company. The firm has been monitoring sales of new agents over the past two years. The response of interest is the profit to the firm (in dollars) or contracts sold by agents over their first year. Among the possible predictors of this performance is the number of new accounts developed by the agent during the first three months of work. Some of these agents were located in new offices, whereas others joined an existing office. Complete parts (a) through (e) below. Click the icon to view the hiring data table. Click the icon to view information on the incremental F-test. (c) Assuming that the model meets the conditions for the MRM, use the incremental F-test to assess the size of the change in R?. (The value of kun for the model with dummy and interaction is 3, with 2 slopes added. You will need to fit the simple regression to get its R for comparison to the multiple regression.) The critical value for the incremental F-test is 4. Calculate the F-statistic. - (Round to two decimal places as needed.) Does the test agree with your visual impression? F= OA. Yes, this agrees with the visual impression. The added variables are statistically significant and the multiple regression is a sufficient model. B. Yes, this agrees with the visual impression. The added variables are not statistically significant and the simple regression is a sufficient model. Click to select your answer(s). A firm would like to monitor the progress of new agents. The goal is to identify "superstar agents" and keep them with the company. The firm has been monitoring sales of new agents over the past two years. The response of interest is the profit to the firm (in dollars) or contracts sold by agents over their first year. Among the possible predictors of this performance is the number of new accounts developed by the agent during the first three months of work. Some of these agents were located in new offices, whereas others joined an existing office. Complete parts (a) through (e) below. Click the icon to view the hiring data table. i Click the icon to view information on the incremental F-test. Does the test agree with your visual impression? O A. Yes, this agrees with the visual impression. The added variables are statistically significant and the multiple regression is a sufficient model. B. Yes, this agrees with the visual impression. The added variables are not statistically significant and the simple regression is a sufficient model. O C. No, this does not agree with the visual impression. This test indicates that the added variables are not statistically significant and the simple regression is sufficient. OD. No, this does not agree with the visual impression. This test indicates that the added variables are statistically significant and the multiple regression is sufficient. (d) Compare the conclusion of the incremental F-test to those of the test of the coefficients of the dummy variable and This Question. Ju pis WA MAIS **115 Ul. Jou pis possible Afirm would like to monitor the progress of new agents. The goal is to identify "superstar agents" and keep them with the company. The firm has been monitoring sales of new agents over the past two years. The response of interest is the profit to the firm (in dollars) or contracts sold by agents over their first year. Among the possible predictors of this performance is the number of new accounts developed by the agent during the first three months of work. Some of these agents were located in new offices, whereas others joined an existing office. Complete parts (a) through (e) below. Click the icon to view the hiring data table. Click the icon to view information on the incremental F-test. (d) Compare the conclusion of the incremental F-test to those of the test of the coefficients of the dummy variable and interaction separately. Do these agree? Explain the similarity or difference. O A. The test agrees with The t-statistics obtained from the new model. OB. The test does not agree with the t-statistics obtained from the new model because of the collinearity produced by this interaction O C. The test does not agree with the t-statistics obtained from the new model because the residuals are not normally distributed OD. The test does not agree with the t-statistics obtained from the new model because the variances are not equal. (e) What do you think about locating new hires in new or existing offices? Would you recommend locating them in one or the other (assuming it could be done without disrupting the current placement procedures)? A firm would like to monitor the progress of new agents. The goal is to identify "superstar agents" and keep them with the company. The firm has been monitoring sales of new agents over the past two years. The response of interest is the profit to the firm (in dollars) or contracts sold by agents over their first year. Among the possible predictors of this performance is the number of new accounts developed by the agent during the first three months of work. Some of these agents were located in new offices, whereas others joined an existing office. Complete parts (a) through (e) below. Click the icon to view the hiring data table. i Click the icon to view information on the incremental F-test. . (e) What do you think about locating new hires in new or existing offices? Would you recommend locating them in one or the other (assuming it could be done without disrupting the current placement procedures)? O A. Recommend locating the new hires in the new offices because it is shown that new hires in the new offices result in higher profits. B. Recommend locating the new hires in the existing offices because it is shown that new hires in the existing offices result in higher profits. OC. Since the added variables are not statistically significant, location of the new hires in either a new or existing office is not important. D. Recommend locating the new hires in the new offices because it is shown that new hires in the new offices result in lower variance of profits. Click to select your answer(s)
Step by Step Solution
There are 3 Steps involved in it

Get step-by-step solutions from verified subject matter experts