

Question: The 10-year historical demand data for a part is presented in the following table. Year H 2 3 5 6 7 8 9 10 Demand
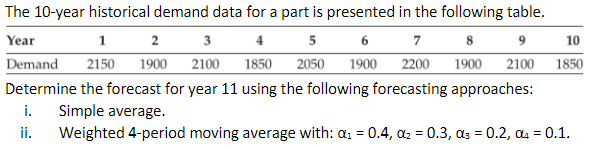
The 10-year historical demand data for a part is presented in the following table. Year H 2 3 5 6 7 8 9 10 Demand 2150 1900 2100 1850 2050 1900 2200 1900 2100 1850 Determine the forecast for year 11 using the following forecasting approaches: i. Simple average. ii. Weighted 4-period moving average with: 01 = 0.4, oz = 0.3, as = 0.2, 04 = 0.1
Step by Step Solution
There are 3 Steps involved in it
1 Expert Approved Answer
Step: 1 Unlock

Question Has Been Solved by an Expert!
Get step-by-step solutions from verified subject matter experts
Step: 2 Unlock
Step: 3 Unlock