

Question: the (a) The data in Table Q1 refers to the decay of a short-lived radioactive isotope. A is activity of the sample and t is
the
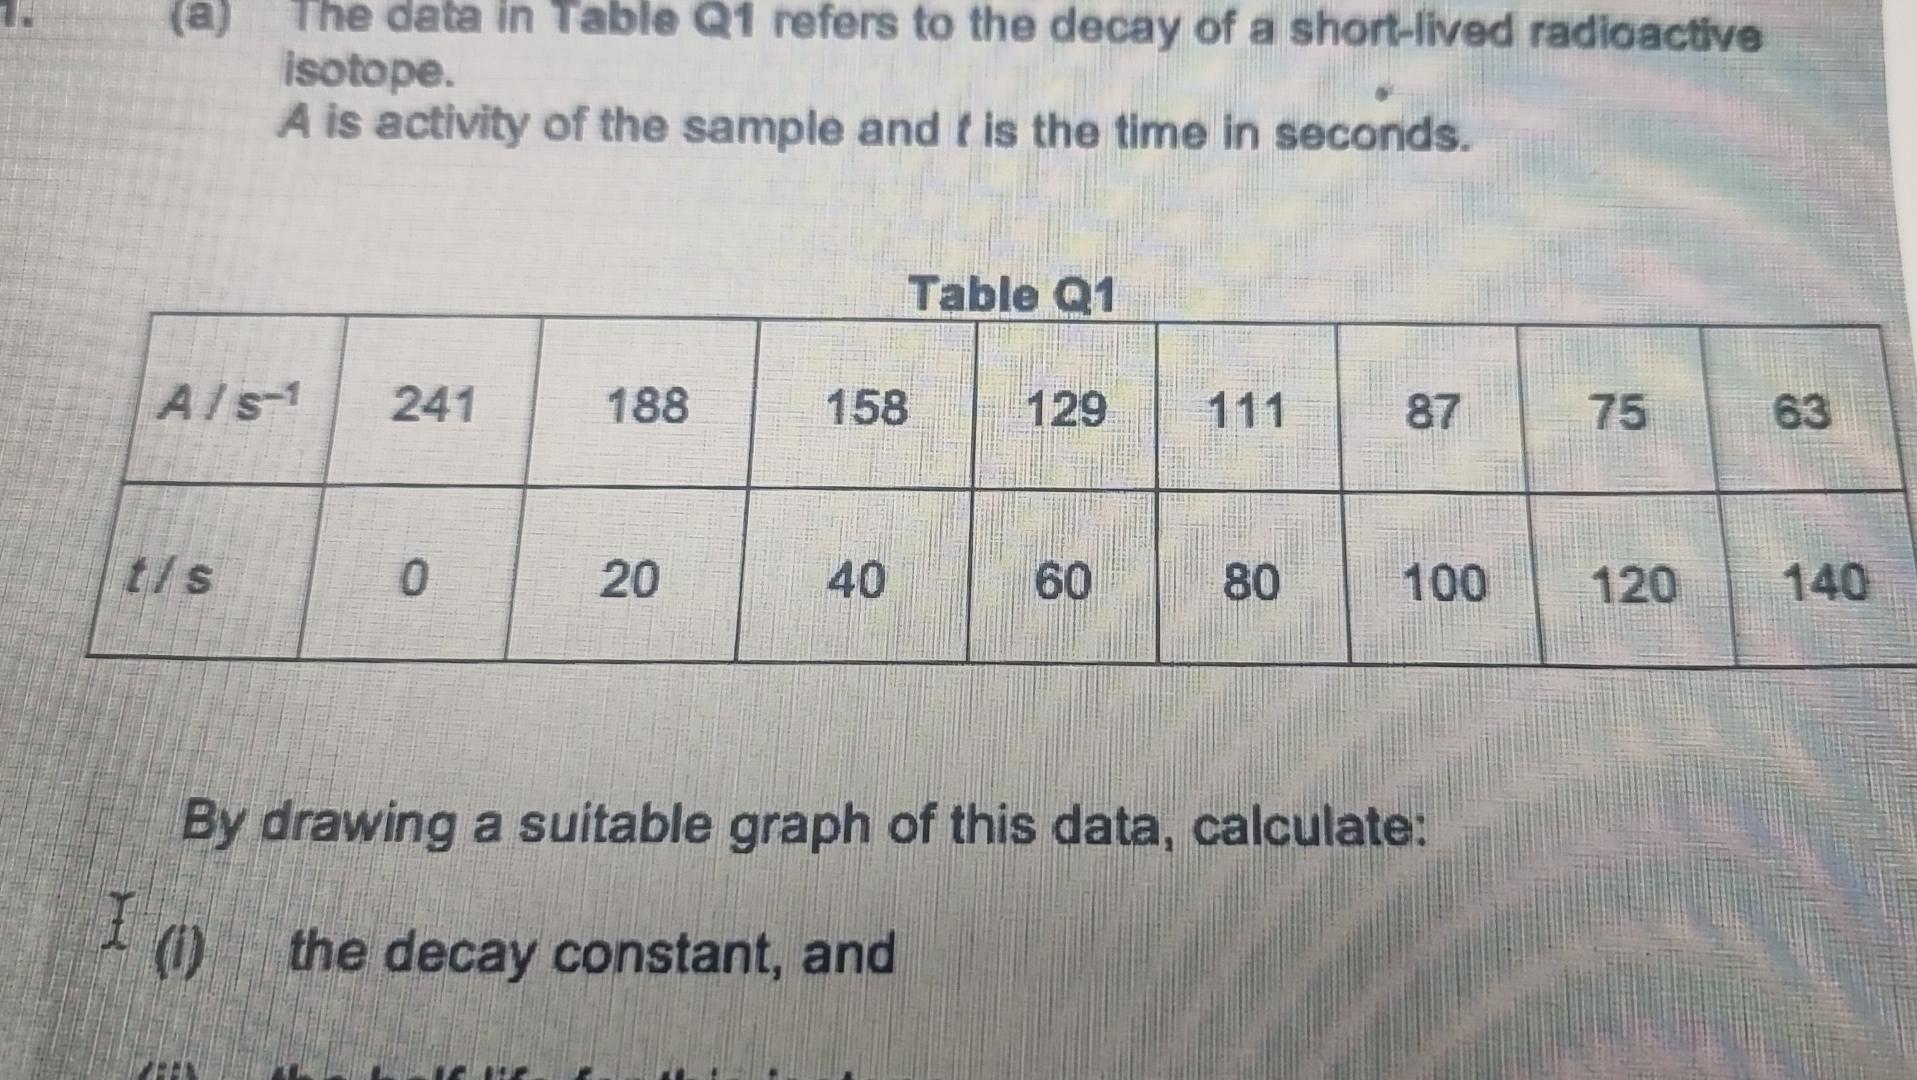
(a) The data in Table Q1 refers to the decay of a short-lived radioactive isotope. A is activity of the sample and t is the time in seconds. By drawing a suitable graph of this data, calculate: (i) the decay constant, and
Step by Step Solution
There are 3 Steps involved in it
1 Expert Approved Answer
Step: 1 Unlock

Question Has Been Solved by an Expert!
Get step-by-step solutions from verified subject matter experts
Step: 2 Unlock
Step: 3 Unlock