

Question: The above figure is a time series plot for a monthly data: a) From the graph, what can you say about this time series

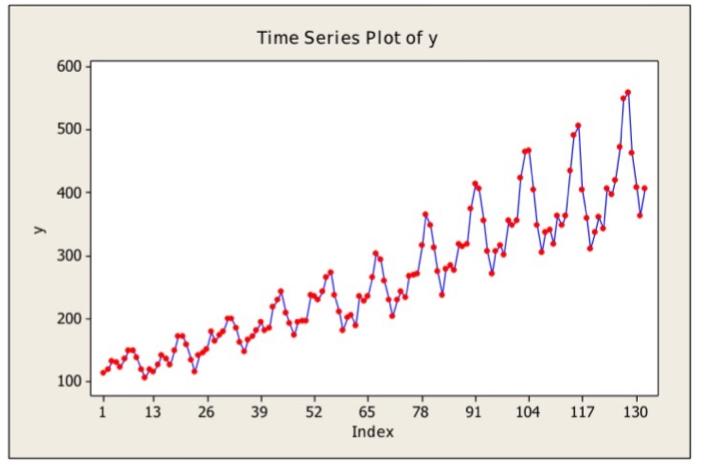
The above figure is a time series plot for a monthly data: a) From the graph, what can you say about this time series data? b) What model(s) do you suggest for forecasting y 600 500- 400 300 200 100- 1 13 26 Time Series Plot of y 39 52 65 78 Index 91 104 117 130
Step by Step Solution
★★★★★
3.58 Rating (144 Votes )
There are 3 Steps involved in it
1 Expert Approved Answer
Step: 1 Unlock

From the above graph we time series see that has incresing trend This means that the seri... View full answer
Question Has Been Solved by an Expert!
Get step-by-step solutions from verified subject matter experts
Step: 2 Unlock
Step: 3 Unlock