

Question: The accompanying boxplot was constructed in Excel for the amount of soda that was poured by a filling machine into 12-ounce soda cans at a
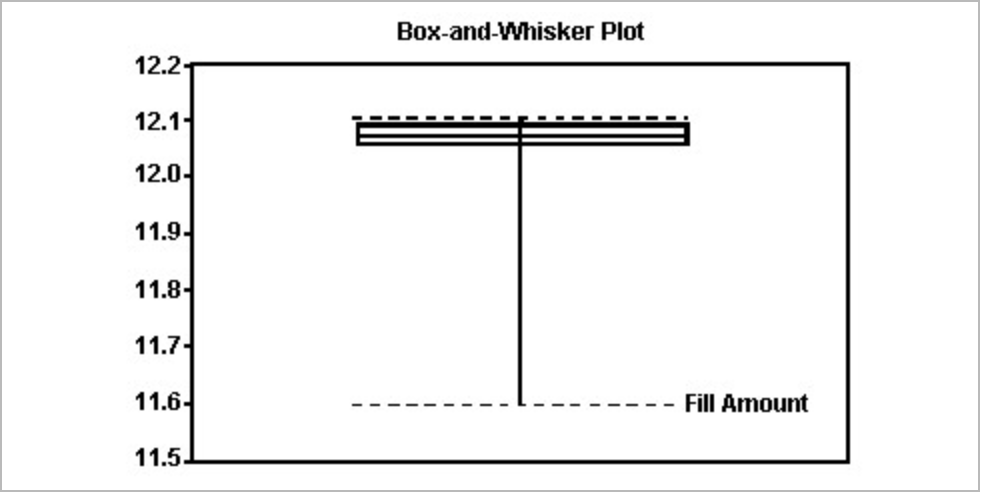
The accompanying boxplot was constructed in Excel for the amount of soda that was poured by a filling machine into 12-ounce soda cans at a local bottling company. Based on the information given in the boxplot, what shape do you believe the data to have? [5 Click the icon to view the boxplot. approximately symmetric skewed to the right skewed to the left OOOO cannot be determined Box-and-Whisker Plot 12.2 12.1 12.0 11.9- 11.8- 11.7- 11.6- Fill Amount 11.5
Step by Step Solution
There are 3 Steps involved in it
1 Expert Approved Answer
Step: 1 Unlock

Question Has Been Solved by an Expert!
Get step-by-step solutions from verified subject matter experts
Step: 2 Unlock
Step: 3 Unlock