

Question: The accompanying scatterplot shows the relationship between the percentage of teenagers who had used marijuana and the percentage of teenagers who had used other drugs
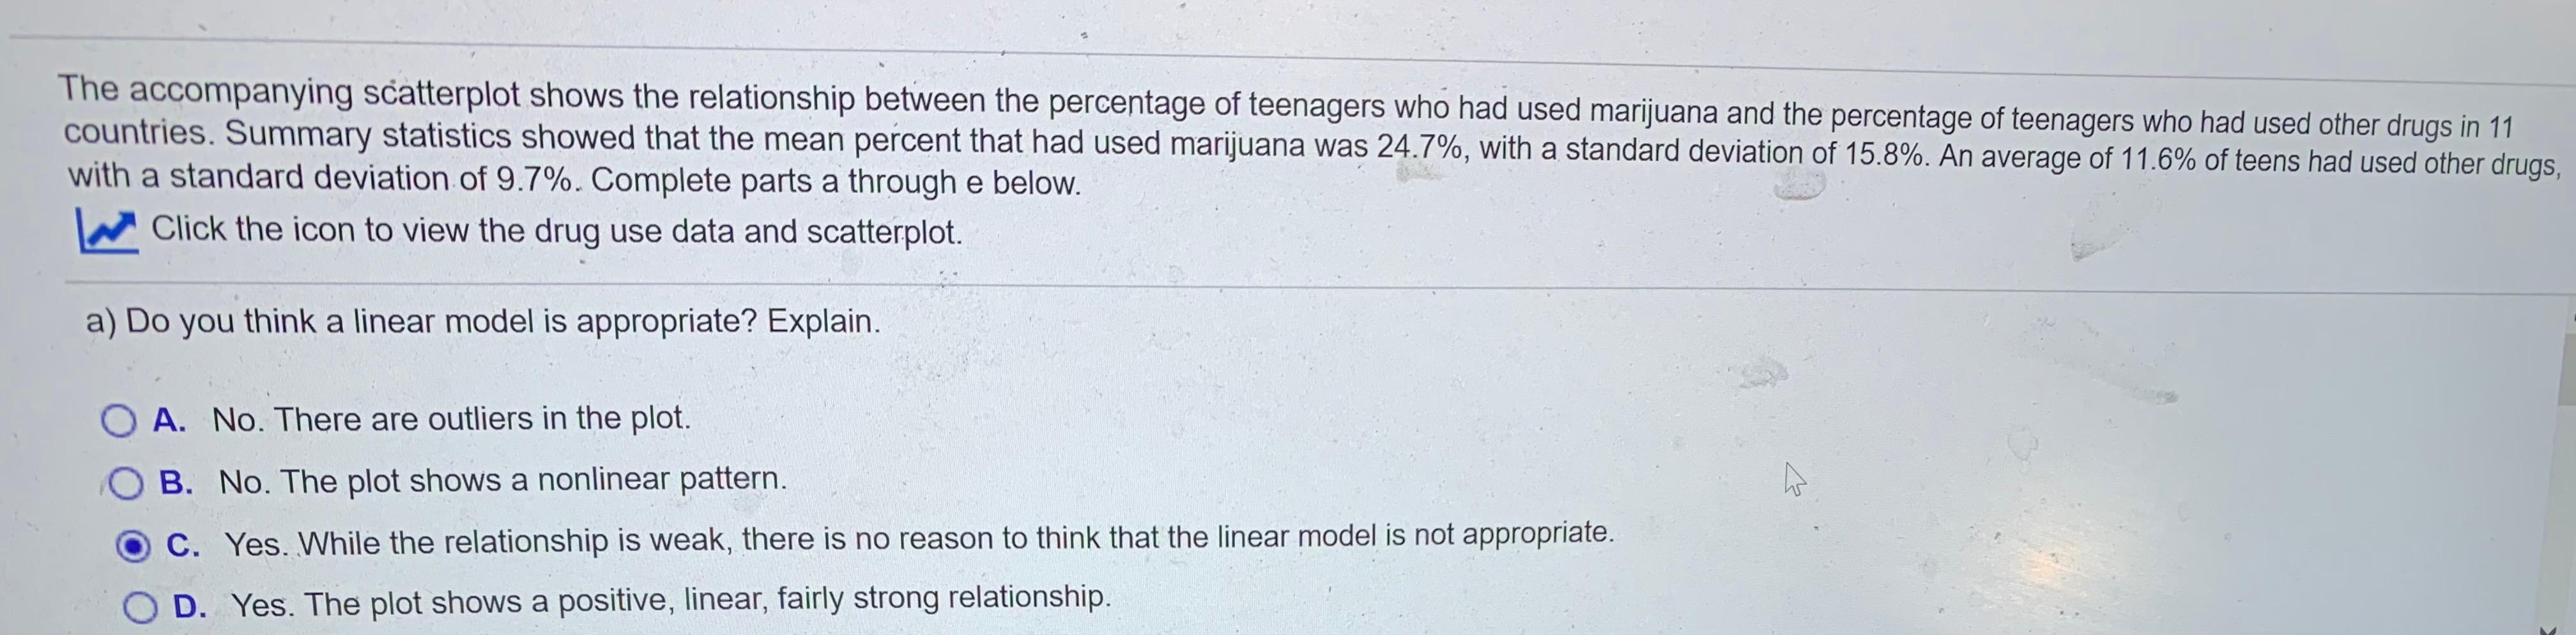
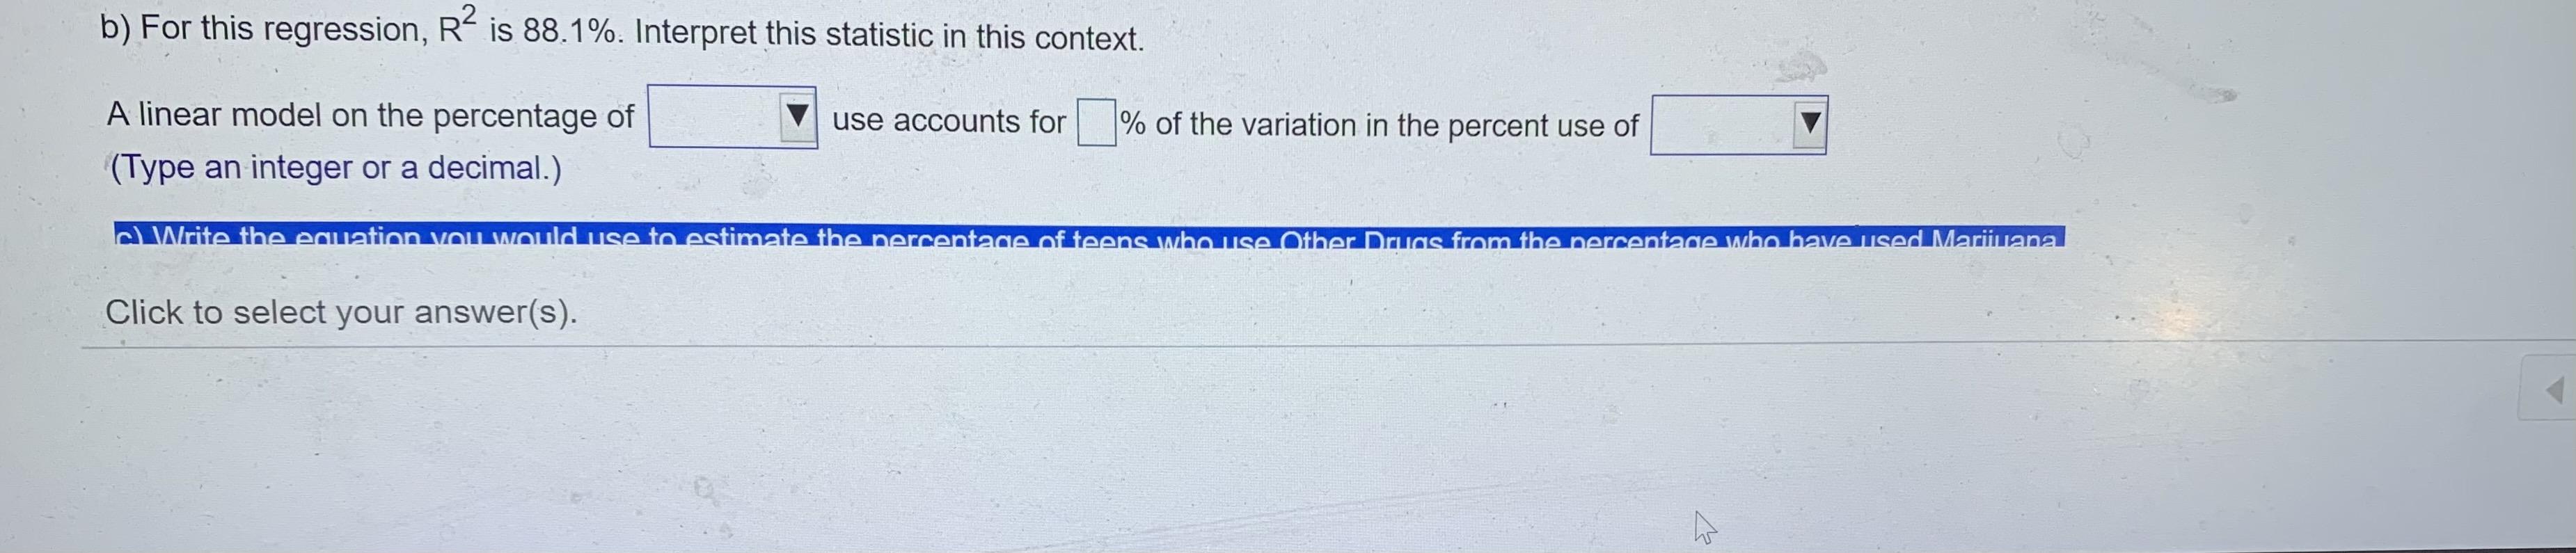
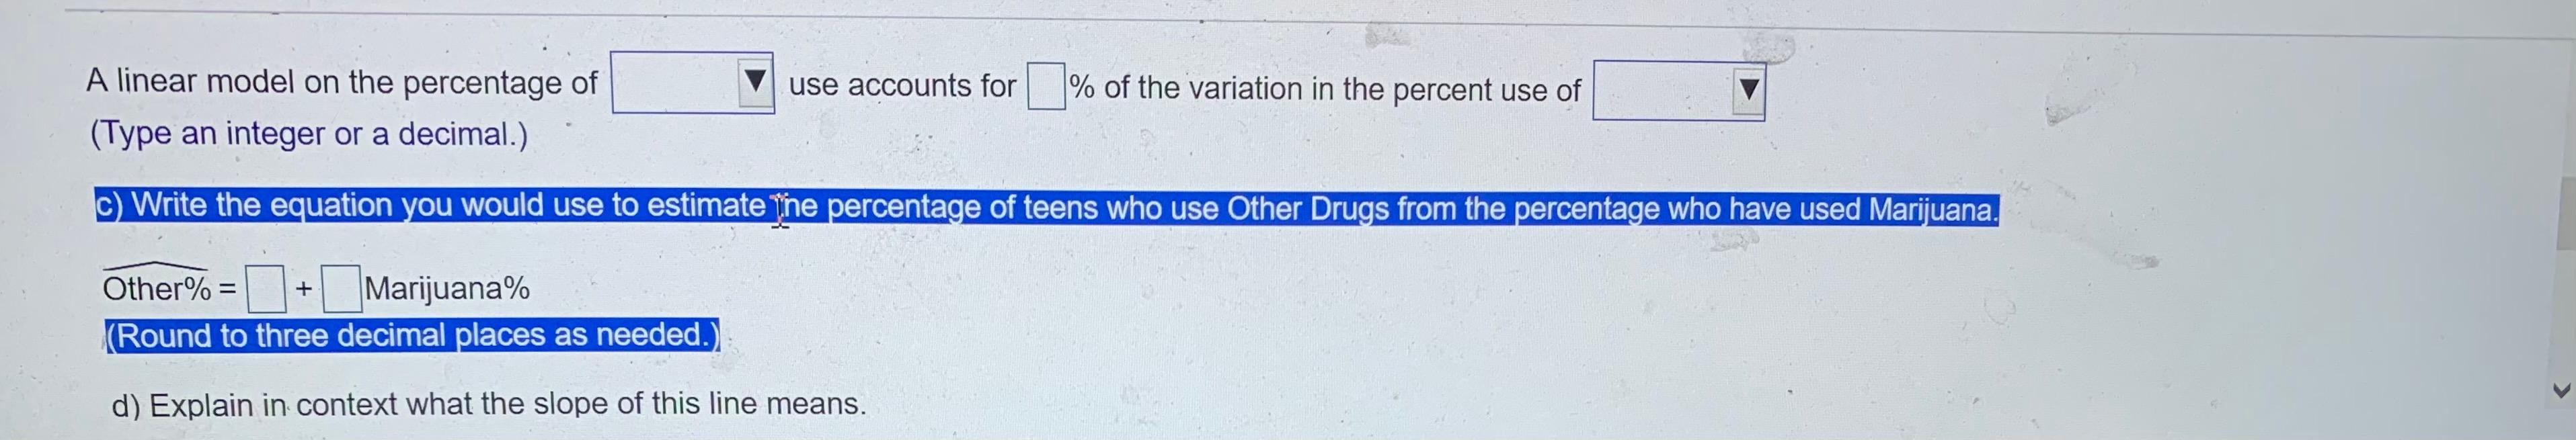
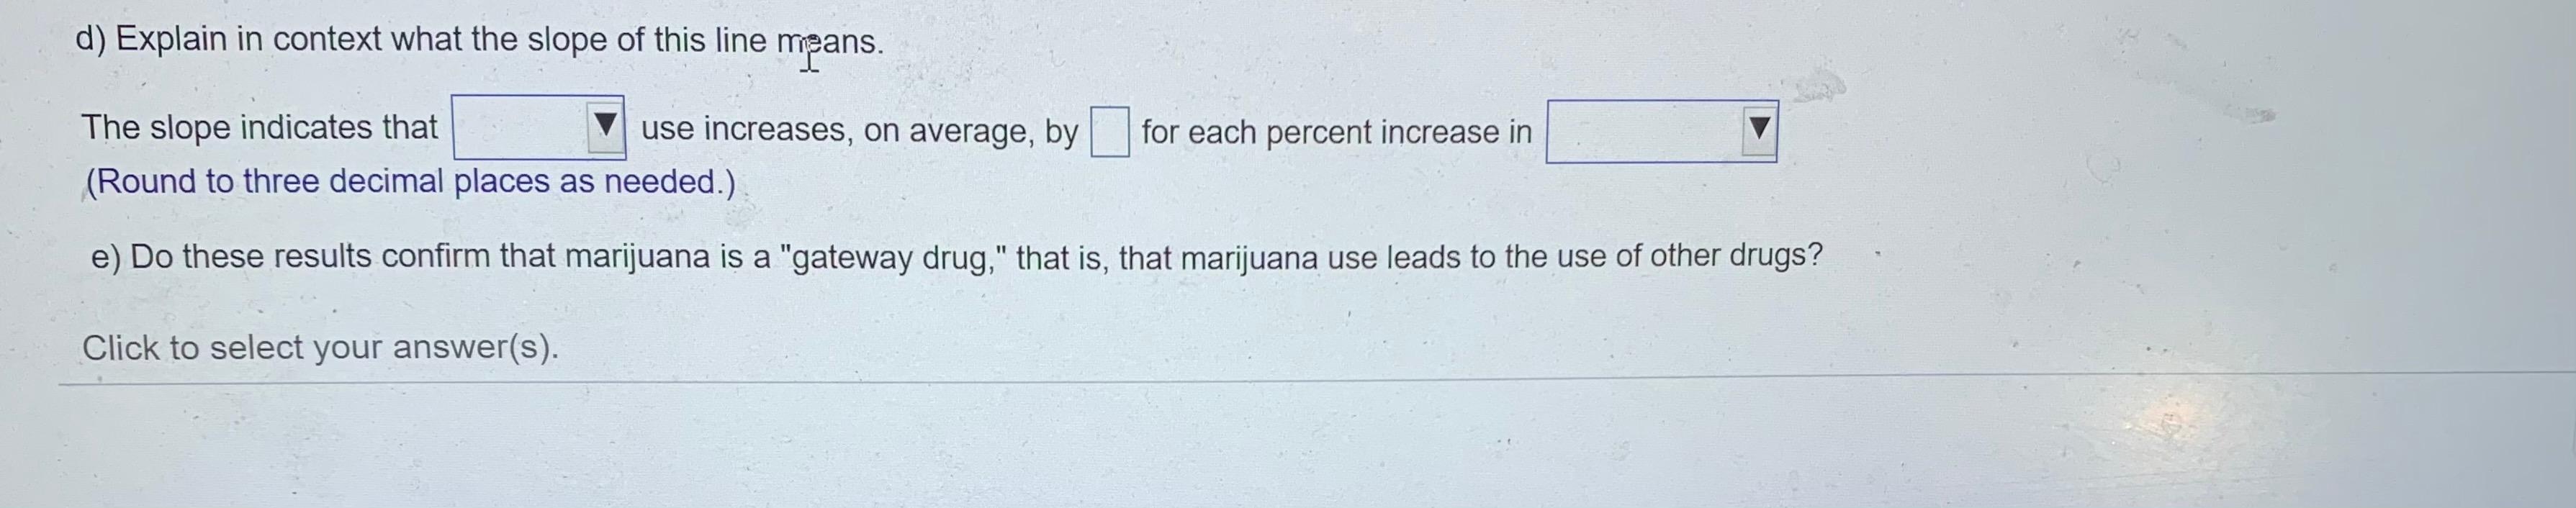
The accompanying scatterplot shows the relationship between the percentage of teenagers who had used marijuana and the percentage of teenagers who had used other drugs in 11 countries. Summary statistics showed that the mean percent that had used marijuana was 24.7%, with a standard deviation of 15.8%. An average of 11.6% of teens had used other drugs, with a standard deviation of 9.7%. Complete parts a through e below. Click the icon to view the drug use data and scatterplot. a) Do you think a linear model is appropriate? Explain. O A. No. There are outliers in the plot. B. No. The plot shows a nonlinear pattern. C. Yes. While the relationship is weak, there is no reason to think that the linear model is not appropriate. O D. Yes. The plot shows a positive, linear, fairly strong relationship. b) For this regression, R2 is 88.1%. Interpret this statistic in this context. A linear model on the percentage of use accounts for % of the variation in the percent use of (Type an integer or a decimal.) alWrite the equation Vou would use to estimate the nercentage of teens who use Other Drugs from the percentage who have lised Mariana Click to select your answer(s). use accounts for % of the variation in the percent use of A linear model on the percentage of (Type an integer or a decimal.) C) Write the equation you would use to estimate the percentage of teens who use Other Drugs from the percentage who have used Marijuana. + Other%= Marijuana% (Round to three decimal places as needed. d) Explain in context what the slope of this line means. d) Explain in context what the slope of this line means. The slope indicates that use increases, on average, by for each percent increase in (Round to three decimal places as needed.) e) Do these results confirm that marijuana is a "gateway drug," that is, that marijuana use leads to the use of other drugs? Click to select your answer(s). e) Do these results confirm that marijuana is a "gateway drug," that is, that marijuana use leads to the use of other drugs? O A. Since the value of R is small, the results do not indicate that marijuana leads to other drug use. B. The results do not show a strong association between marijuana and other drug use. C. Since the value of R2 is large, the results confirm that marijuana leads to other drug use. O D. The results indicate an association between marijuana and other drug use; however, association does not imply causation. clientelont vouonewarlal The accompanying scatterplot shows the relationship between the percentage of teenagers who had used marijuana and the percentage of teenagers who had used other drugs in 11 countries. Summary statistics showed that the mean percent that had used marijuana was 24.7%, with a standard deviation of 15.8%. An average of 11.6% of teens had used other drugs, with a standard deviation of 9.7%. Complete parts a through e below. Click the icon to view the drug use data and scatterplot. a) Do you think a linear model is appropriate? Explain. O A. No. There are outliers in the plot. B. No. The plot shows a nonlinear pattern. C. Yes. While the relationship is weak, there is no reason to think that the linear model is not appropriate. O D. Yes. The plot shows a positive, linear, fairly strong relationship. b) For this regression, R2 is 88.1%. Interpret this statistic in this context. A linear model on the percentage of use accounts for % of the variation in the percent use of (Type an integer or a decimal.) alWrite the equation Vou would use to estimate the nercentage of teens who use Other Drugs from the percentage who have lised Mariana Click to select your answer(s). use accounts for % of the variation in the percent use of A linear model on the percentage of (Type an integer or a decimal.) C) Write the equation you would use to estimate the percentage of teens who use Other Drugs from the percentage who have used Marijuana. + Other%= Marijuana% (Round to three decimal places as needed. d) Explain in context what the slope of this line means. d) Explain in context what the slope of this line means. The slope indicates that use increases, on average, by for each percent increase in (Round to three decimal places as needed.) e) Do these results confirm that marijuana is a "gateway drug," that is, that marijuana use leads to the use of other drugs? Click to select your answer(s). e) Do these results confirm that marijuana is a "gateway drug," that is, that marijuana use leads to the use of other drugs? O A. Since the value of R is small, the results do not indicate that marijuana leads to other drug use. B. The results do not show a strong association between marijuana and other drug use. C. Since the value of R2 is large, the results confirm that marijuana leads to other drug use. O D. The results indicate an association between marijuana and other drug use; however, association does not imply causation. clientelont vouonewarlal
Step by Step Solution
There are 3 Steps involved in it

Get step-by-step solutions from verified subject matter experts