

Question: The activity, expected time, t c and activity standard deviation, of a transmission line project are shown in Table 1 . [ Aktiviti , jangkaan
The activity, expected time, and activity standard deviation, of a transmission line
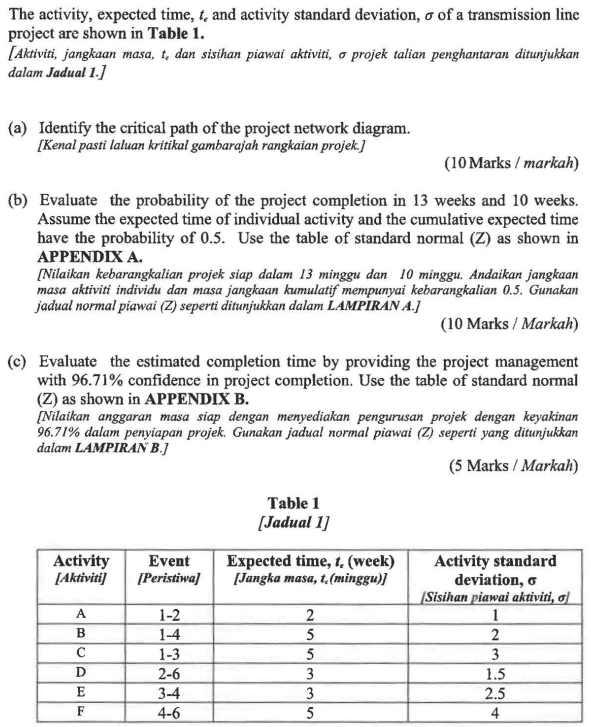
project are shown in Table
Aktiviti jangkaan masa, dan sisihan piawai aktiviti, projek talian penghantaran ditunjukkan
dalam Jadual
a Identify the critical path of the project network diagram.
Kenal pasti laluan kritikal gambarajah rangkaian projek.
Marks markah
b Evaluate the probability of the project completion in weeks and weeks.
Assume the expected time of individual activity and the cumulative expected time
have the probability of Use the table of standard normal as shown in
APPENDIX A
Nilaikan kebarangkalian projek siap dalam minggu dan minggu. Andaikan jangkaan
masa aktiviti individu dan masa jangkaan kumulatif mempunyai kebarangkalian Gunakan
jadual normal piawai Z seperti ditunjukkan dalam LAMPIRAN A
Marks Markah
c Evaluate the estimated completion time by providing the project management
with confidence in project completion. Use the table of standard normal
Z as shown in APPENDIX B
Nilaikan anggaran masa siap dengan menyediakan pengurusan projek dengan keyakinan
dalam penyiapan projek. Gunakan jadual normal piawai Z seperti yang ditunjukkan
dalam LAMPIRAN B
Marks Markah
Table
Jadual
Step by Step Solution
There are 3 Steps involved in it
1 Expert Approved Answer
Step: 1 Unlock

Question Has Been Solved by an Expert!
Get step-by-step solutions from verified subject matter experts
Step: 2 Unlock
Step: 3 Unlock