

Question: The Activity Management ratios explain a companys.....(see text) 1 The specific Activity Management ratios mean what? .....(see and cite text) 2 Note two specific Wal-Marts
The Activity Management ratios explain a companys.....(see text)
1 The specific Activity Management ratios mean what? .....(see and cite text) 2 Note two specific Wal-Marts Activity Mgmt. ratios: what is the three year trend
3 Which trend needs elaboration? ...... To continue this positive trend Wal-Mart should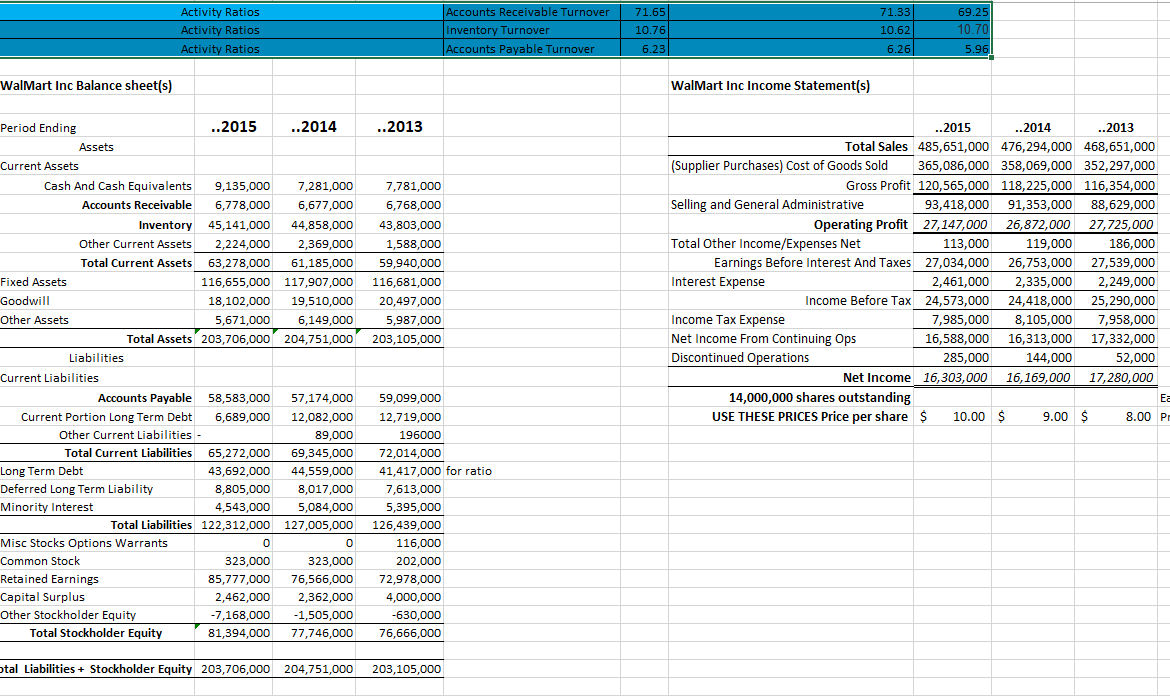
71.33 Activity Ratios Activity Ratios Activity Ratios Accounts Receivable Turnover Inventory Turnover Accounts Payable Turnover 71.65 10.76 69.25 10.70 10.62 6.23 6.26 5.96 Walmart Inc Balance sheet(s) Walmart Inc Income Statement(s) Period Ending ..2015 ..2014 ..2013 Assets Current Assets Cash And Cash Equivalents 9,135,000 7,281,000 7,781,000 Accounts Receivable 6,778,000 6,677,000 6,768,000 Inventory 45,141,000 44,858,000 43,803,000 Other Current Assets 2,224,000 2,369,000 1,588,000 Total Current Assets 63,278,000 61,185,000 59,940,000 Fixed Assets 116,655,000 117,907,000 116,681,000 Goodwill 18,102,000 19,510,000 20,497,000 Other Assets 5,671,000 6,149,000 5,987,000 Total Assets 203,706,000 204,751,000 203, 105,000 Liabilities Current Liabilities Accounts Payable 58,583,000 57,174,000 59,099,000 Current Portion Long Term Debt 6,689,000 12,082,000 12,719,000 Other Current Liabilities - 89,000 196000 Total Current Liabilities 65,272,000 69,345,000 72,014,000 Long Term Debt 43,692,000 44,559,000 41,417,000 for ratio Deferred Long Term Liability 8,805,000 8,017,000 7,613,000 Minority Interest 4,543,000 5,084,000 5,395,000 Total Liabilities 122,312,000 127,005,000 126,439,000 Misc Stocks Options Warrants 0 0 116,000 Common Stock 323,000 323,000 202,000 Retained Earnings 85,777,000 76,566,000 72,978,000 Capital Surplus 2,462,000 2,362,000 4,000,000 Other Stockholder Equity -7,168,000 -1,505,000 -630,000 Total Stockholder Equity 81,394,000 77,746,000 76,666,000 ..2015 ..2014 ..2013 Total Sales 485,651,000 476,294,000 468,651,000 (Supplier Purchases) Cost of Goods Sold 365,086,000 358,069,000 352,297,000 Gross Profit 120,565,000 118,225,000 116,354,000 Selling and General Administrative 93,418,000 91,353,000 88,629,000 Operating Profit 27,147,000 26,872,000 27,725,000 Total Other Income/Expenses Net 113,000 119,000 186,000 Earnings Before Interest And Taxes 27,034,000 26,753,000 27,539,000 Interest Expense 2,461,000 2,335,000 2,249,000 Income Before Tax 24,573,000 24,418,000 25,290,000 Income Tax Expense 7,985,000 8,105,000 7,958,000 Net Income From Continuing Ops 16,588,000 16,313,000 17,332,000 Discontinued Operations 285,000 144,000 52,000 Net Income 16,303,000 16,169,000 17,280,000 14,000,000 shares outstanding Ea USE THESE PRICES Price per share $ 10.00 $ 9.00 $ 8.00 P otal Liabilities + Stockholder Equity 203,706,000 204,751,000 203, 105,000 71.33 Activity Ratios Activity Ratios Activity Ratios Accounts Receivable Turnover Inventory Turnover Accounts Payable Turnover 71.65 10.76 69.25 10.70 10.62 6.23 6.26 5.96 Walmart Inc Balance sheet(s) Walmart Inc Income Statement(s) Period Ending ..2015 ..2014 ..2013 Assets Current Assets Cash And Cash Equivalents 9,135,000 7,281,000 7,781,000 Accounts Receivable 6,778,000 6,677,000 6,768,000 Inventory 45,141,000 44,858,000 43,803,000 Other Current Assets 2,224,000 2,369,000 1,588,000 Total Current Assets 63,278,000 61,185,000 59,940,000 Fixed Assets 116,655,000 117,907,000 116,681,000 Goodwill 18,102,000 19,510,000 20,497,000 Other Assets 5,671,000 6,149,000 5,987,000 Total Assets 203,706,000 204,751,000 203, 105,000 Liabilities Current Liabilities Accounts Payable 58,583,000 57,174,000 59,099,000 Current Portion Long Term Debt 6,689,000 12,082,000 12,719,000 Other Current Liabilities - 89,000 196000 Total Current Liabilities 65,272,000 69,345,000 72,014,000 Long Term Debt 43,692,000 44,559,000 41,417,000 for ratio Deferred Long Term Liability 8,805,000 8,017,000 7,613,000 Minority Interest 4,543,000 5,084,000 5,395,000 Total Liabilities 122,312,000 127,005,000 126,439,000 Misc Stocks Options Warrants 0 0 116,000 Common Stock 323,000 323,000 202,000 Retained Earnings 85,777,000 76,566,000 72,978,000 Capital Surplus 2,462,000 2,362,000 4,000,000 Other Stockholder Equity -7,168,000 -1,505,000 -630,000 Total Stockholder Equity 81,394,000 77,746,000 76,666,000 ..2015 ..2014 ..2013 Total Sales 485,651,000 476,294,000 468,651,000 (Supplier Purchases) Cost of Goods Sold 365,086,000 358,069,000 352,297,000 Gross Profit 120,565,000 118,225,000 116,354,000 Selling and General Administrative 93,418,000 91,353,000 88,629,000 Operating Profit 27,147,000 26,872,000 27,725,000 Total Other Income/Expenses Net 113,000 119,000 186,000 Earnings Before Interest And Taxes 27,034,000 26,753,000 27,539,000 Interest Expense 2,461,000 2,335,000 2,249,000 Income Before Tax 24,573,000 24,418,000 25,290,000 Income Tax Expense 7,985,000 8,105,000 7,958,000 Net Income From Continuing Ops 16,588,000 16,313,000 17,332,000 Discontinued Operations 285,000 144,000 52,000 Net Income 16,303,000 16,169,000 17,280,000 14,000,000 shares outstanding Ea USE THESE PRICES Price per share $ 10.00 $ 9.00 $ 8.00 P otal Liabilities + Stockholder Equity 203,706,000 204,751,000 203, 105,000
Step by Step Solution
There are 3 Steps involved in it

Get step-by-step solutions from verified subject matter experts