

Question: the answer for 1-7 are there, could ypu please answer 8-12 Answer 1 of 1 Done A,B) 733 AVERAGE YEAR SEMESTER GA PAHA FRESHMAN FALL
the answer for 1-7 are there, could ypu please answer 8-12 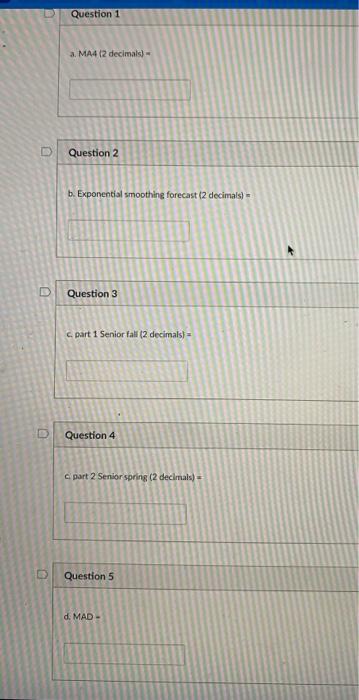
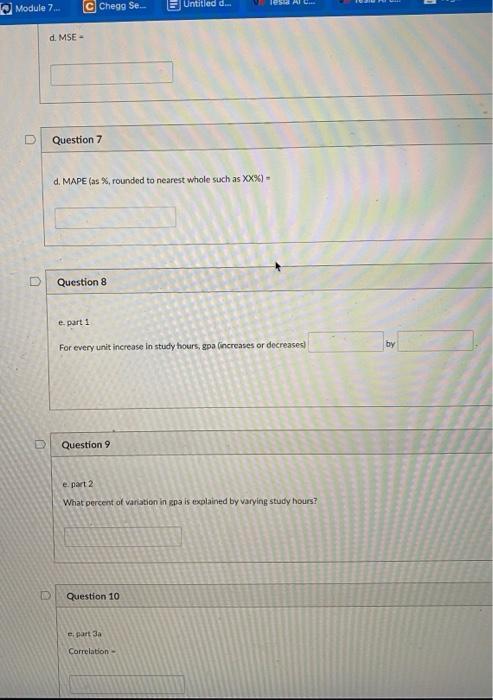
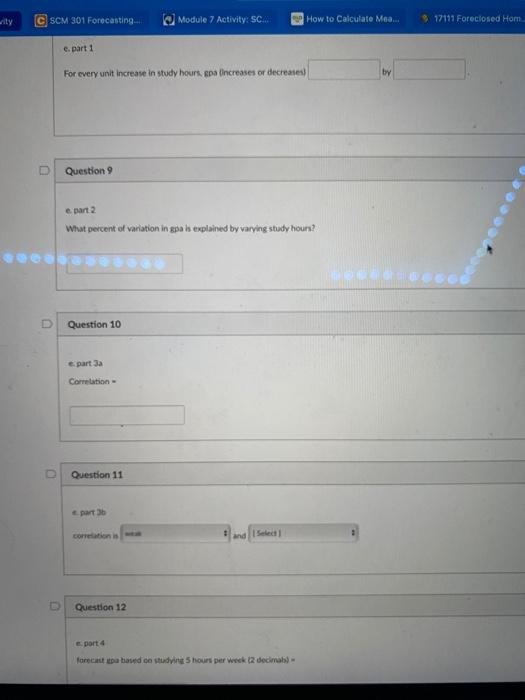


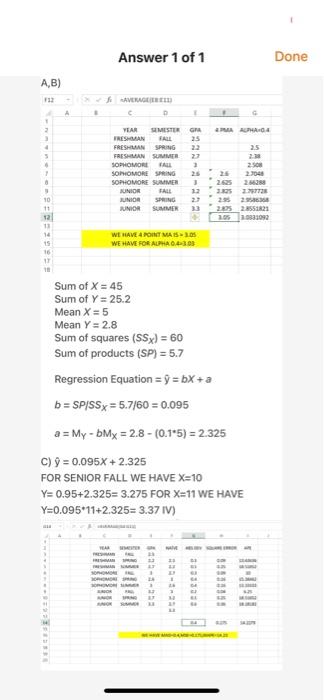
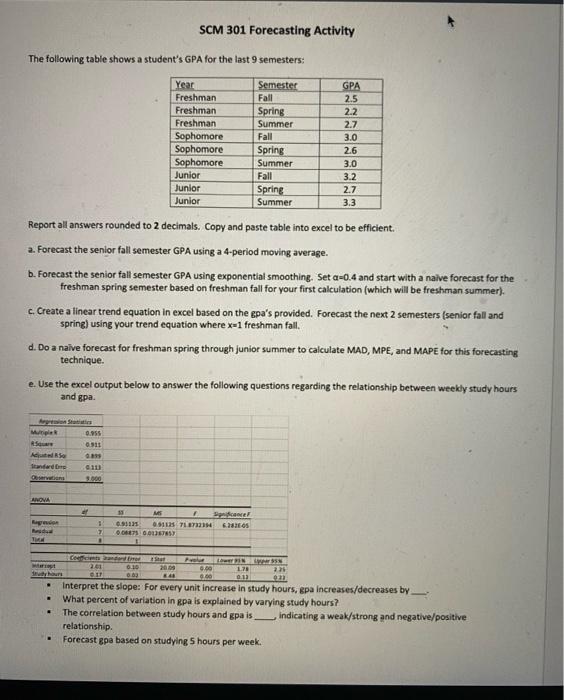
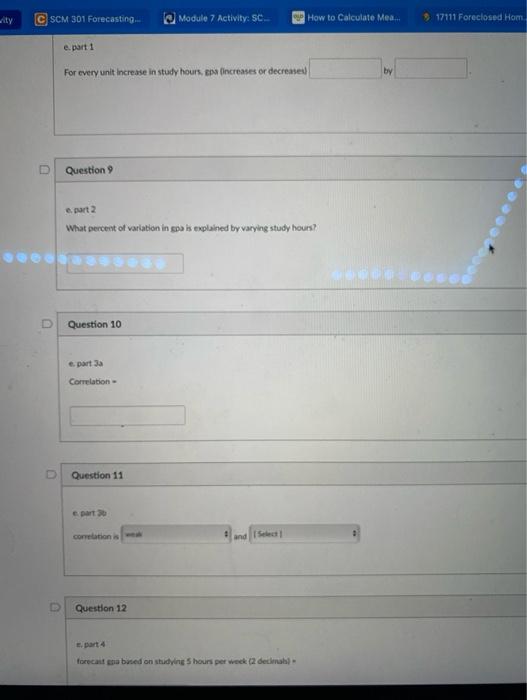
Answer 1 of 1 Done A,B) 733 AVERAGE YEAR SEMESTER GA PAHA FRESHMAN FALL 25 FRESHMAN SPRING 22 2.5 FRESHMAN SUMMER 27 2 SOPHOMORA 2.08 SOPOMORE SPRING 25 26 2.7048 SOPHOMORE SUMMER 12.55 2.288 JUNIOR FALL 12 2.325 27738 JUNIOR SPRING 2:55 25 JUNIOR SUMMER 33 2005 2.4558823 2.95 10331092 WE HAVE FOUNT MAIS 30 WE HAVE FOR AURA 4.30 2 11 12 11 14 15 16 17 Sum of X = 45 Sum of Y = 25.2 Mean X = 5 Mean Y = 2.8 Sum of squares (55x) = 60 Sum of products (SP) = 5.7 Regression Equation = y =bX+a b = SP/SSx = 5.7/60 = 0.095 a = My - My = 2.8 -0.15) = 2.325 c) 9 = 0.095X + 2.325 FOR SENIOR FALL WE HAVE X=10 Y=0.95+2.325= 3.275 FOR X=11 WE HAVE Y=0.095*11+2.325= 3.37 IV) SONOVO OOON AMOROU SCM 301 Forecasting Activity The following table shows a student's GPA for the last 9 semesters: Year Freshman Freshman Freshman Sophomore Sophomore Sophomore Junior Junior Junior Semester Fall Spring Summer Fall Spring Summer Fall Spring Summer GPA 2.5 2.2 2.7 3.0 2.6 3.0 3.2 2.7 3.3 Report all answers rounded to 2 decimals. Copy and paste table into excel to be efficient. 2. Forecast the senior fall semester GPA using a 4-period moving average. b. Forecast the senior fall semester GPA using exponential smoothing. Set a=0.4 and start with a naive forecast for the freshman spring semester based on freshman fall for your first calculation (which will be freshman summer). c. Create a linear trend equation in excel based on the gpa's provided. Forecast the next 2 semesters (senior fall and spring) using your trend equation where x-1 freshman fall. d. Do a naive forecast for freshman spring through junior summer to calculate MAD, MPE, and MAPE for this forecasting technique. e. Use the excel output below to answer the following questions regarding the relationship between weekly study hours and gpa. 955 0911 AS andard 10 000 ANOVA 15 M Snel 0.53125 1 TIHTIN ES 90671 OOSTA 201 11 6.10 . 2009 84 6. 0.00 178 012 . 2 * Interpret the slope: For every unit increase in study hours, gpa increases/decreases by What percent of variation in gpa is explained by varying study hours? The correlation between study hours and gpa is _indicating a weak/strong and negative/positive relationship Forecast gpa based on studying 5 hours per week. . Aty CSCM 301 Forecasting. Module 7 Activity: SC RP How to Calculate Mea... 17111 Foreclosed Hom e.part1 For every unit Increase in study hours, era increases or decremed by D Question 9 part 2 What percent of varlation in goa is explained by varying study hours) D Question 10 c. part 3 Correlation - D Question 11 c. part 2 corretation 4 Isle and u Question 12 forecast a bused on studying 5 hours per week (decima Question 1 a. MA4 (2 decimals) Question 2 b. Exponential smoothing forecast (2 decimals) D Question 3 part 1 Senior fall 2 decimals] = e Question 4 a part 2 Senior spring (2 decimals) = Question 5 d. MAD- Module 7. SA C Chegg Se.. Untitled d. d. MSE - U Question 7 d. MAPE (as%, rounded to nearest whole such as XX%) - Question 8 e. part 1 For every unit increase in study hours, gpa lincreases or decreases) by D Question 9 e. part 2 What percent of variation in pa is explained by varying study hours? Question 10 part 3 Correlation - ity SCM 301 Forecasting Module 7 Activity: SC. How to Calculate Moa... % 17111 Foreclosed Hom e. part 1 For every unit increase in study hours, coa Oincreases or decreases) D Question 9 e parte What percent of variation in gpa h explained by varying study hours? D Question 10 parta Correlation Question 11 part 3b coreanis - and Setel D Question 12 E.part4 foreca pa bowed oo studying 5 hours per week 2 decimab) - SCM 301 Forecasting Activity The following table shows a student's GPA for the last 9 semesters: Year Freshman Freshman Freshman Sophomore Sophomore Sophomore Junior Junior Junior Semester Fall Spring Summer Fall Spring Summer Fall Spring Summer GPA 2.5 2.2 2.7 3.0 2.6 3.0 3.2 2.7 3.3 Report all answers rounded to 2 decimals. Copy and paste table into excel to be efficient. 2. Forecast the senior fall semester GPA using a 4-period moving average. b. Forecast the senior fall semester GPA using exponential smoothing. Set a=0.4 and start with a naive forecast for the freshman spring semester based on freshman fall for your first calculation (which will be freshman summer). c. Create a linear trend equation in excel based on the gpa's provided. Forecast the next 2 semesters (senior fall and spring) using your trend equation where x-1 freshman fall. d. Do a naive forecast for freshman spring through junior summer to calculate MAD, MPE, and MAPE for this forecasting technique. e. Use the excel output below to answer the following questions regarding the relationship between weekly study hours and gpa. 955 0911 AS andard 10 000 ANOVA 15 M Snel 0.53125 1 TIHTIN ES 90671 OOSTA 201 11 6.10 . 2009 84 6. 0.00 178 012 . 2 * Interpret the slope: For every unit increase in study hours, gpa increases/decreases by What percent of variation in gpa is explained by varying study hours? The correlation between study hours and gpa is _indicating a weak/strong and negative/positive relationship Forecast gpa based on studying 5 hours per week. . Answer 1 of 1 Done A,B) 733 AVERAGE YEAR SEMESTER GA PAHA FRESHMAN FALL 25 FRESHMAN SPRING 22 2.5 FRESHMAN SUMMER 27 2 SOPHOMORA 2.08 SOPOMORE SPRING 25 26 2.7048 SOPHOMORE SUMMER 12.55 2.288 JUNIOR FALL 12 2.325 27738 JUNIOR SPRING 2:55 25 JUNIOR SUMMER 33 2005 2.4558823 2.95 10331092 WE HAVE FOUNT MAIS 30 WE HAVE FOR AURA 4.30 2 11 12 11 14 15 16 17 Sum of X = 45 Sum of Y = 25.2 Mean X = 5 Mean Y = 2.8 Sum of squares (55x) = 60 Sum of products (SP) = 5.7 Regression Equation = y =bX+a b = SP/SSx = 5.7/60 = 0.095 a = My - My = 2.8 -0.15) = 2.325 c) 9 = 0.095X + 2.325 FOR SENIOR FALL WE HAVE X=10 Y=0.95+2.325= 3.275 FOR X=11 WE HAVE Y=0.095*11+2.325= 3.37 IV) SONOVO OOON AMOROU Answer 1 of 1 Done A,B) 733 AVERAGE YEAR SEMESTER GA PAHA FRESHMAN FALL 25 FRESHMAN SPRING 22 2.5 FRESHMAN SUMMER 27 2 SOPHOMORA 2.08 SOPOMORE SPRING 25 26 2.7048 SOPHOMORE SUMMER 12.55 2.288 JUNIOR FALL 12 2.325 27738 JUNIOR SPRING 2:55 25 JUNIOR SUMMER 33 2005 2.4558823 2.95 10331092 WE HAVE FOUNT MAIS 30 WE HAVE FOR AURA 4.30 2 11 12 11 14 15 16 17 Sum of X = 45 Sum of Y = 25.2 Mean X = 5 Mean Y = 2.8 Sum of squares (55x) = 60 Sum of products (SP) = 5.7 Regression Equation = y =bX+a b = SP/SSx = 5.7/60 = 0.095 a = My - My = 2.8 -0.15) = 2.325 c) 9 = 0.095X + 2.325 FOR SENIOR FALL WE HAVE X=10 Y=0.95+2.325= 3.275 FOR X=11 WE HAVE Y=0.095*11+2.325= 3.37 IV) SONOVO OOON AMOROU SCM 301 Forecasting Activity The following table shows a student's GPA for the last 9 semesters: Year Freshman Freshman Freshman Sophomore Sophomore Sophomore Junior Junior Junior Semester Fall Spring Summer Fall Spring Summer Fall Spring Summer GPA 2.5 2.2 2.7 3.0 2.6 3.0 3.2 2.7 3.3 Report all answers rounded to 2 decimals. Copy and paste table into excel to be efficient. 2. Forecast the senior fall semester GPA using a 4-period moving average. b. Forecast the senior fall semester GPA using exponential smoothing. Set a=0.4 and start with a naive forecast for the freshman spring semester based on freshman fall for your first calculation (which will be freshman summer). c. Create a linear trend equation in excel based on the gpa's provided. Forecast the next 2 semesters (senior fall and spring) using your trend equation where x-1 freshman fall. d. Do a naive forecast for freshman spring through junior summer to calculate MAD, MPE, and MAPE for this forecasting technique. e. Use the excel output below to answer the following questions regarding the relationship between weekly study hours and gpa. 955 0911 AS andard 10 000 ANOVA 15 M Snel 0.53125 1 TIHTIN ES 90671 OOSTA 201 11 6.10 . 2009 84 6. 0.00 178 012 . 2 * Interpret the slope: For every unit increase in study hours, gpa increases/decreases by What percent of variation in gpa is explained by varying study hours? The correlation between study hours and gpa is _indicating a weak/strong and negative/positive relationship Forecast gpa based on studying 5 hours per week. . Aty CSCM 301 Forecasting. Module 7 Activity: SC RP How to Calculate Mea... 17111 Foreclosed Hom e.part1 For every unit Increase in study hours, era increases or decremed by D Question 9 part 2 What percent of varlation in goa is explained by varying study hours) D Question 10 c. part 3 Correlation - D Question 11 c. part 2 corretation 4 Isle and u Question 12 forecast a bused on studying 5 hours per week (decima Question 1 a. MA4 (2 decimals) Question 2 b. Exponential smoothing forecast (2 decimals) D Question 3 part 1 Senior fall 2 decimals] = e Question 4 a part 2 Senior spring (2 decimals) = Question 5 d. MAD- Module 7. SA C Chegg Se.. Untitled d. d. MSE - U Question 7 d. MAPE (as%, rounded to nearest whole such as XX%) - Question 8 e. part 1 For every unit increase in study hours, gpa lincreases or decreases) by D Question 9 e. part 2 What percent of variation in pa is explained by varying study hours? Question 10 part 3 Correlation - ity SCM 301 Forecasting Module 7 Activity: SC. How to Calculate Moa... % 17111 Foreclosed Hom e. part 1 For every unit increase in study hours, coa Oincreases or decreases) D Question 9 e parte What percent of variation in gpa h explained by varying study hours? D Question 10 parta Correlation Question 11 part 3b coreanis - and Setel D Question 12 E.part4 foreca pa bowed oo studying 5 hours per week 2 decimab) - SCM 301 Forecasting Activity The following table shows a student's GPA for the last 9 semesters: Year Freshman Freshman Freshman Sophomore Sophomore Sophomore Junior Junior Junior Semester Fall Spring Summer Fall Spring Summer Fall Spring Summer GPA 2.5 2.2 2.7 3.0 2.6 3.0 3.2 2.7 3.3 Report all answers rounded to 2 decimals. Copy and paste table into excel to be efficient. 2. Forecast the senior fall semester GPA using a 4-period moving average. b. Forecast the senior fall semester GPA using exponential smoothing. Set a=0.4 and start with a naive forecast for the freshman spring semester based on freshman fall for your first calculation (which will be freshman summer). c. Create a linear trend equation in excel based on the gpa's provided. Forecast the next 2 semesters (senior fall and spring) using your trend equation where x-1 freshman fall. d. Do a naive forecast for freshman spring through junior summer to calculate MAD, MPE, and MAPE for this forecasting technique. e. Use the excel output below to answer the following questions regarding the relationship between weekly study hours and gpa. 955 0911 AS andard 10 000 ANOVA 15 M Snel 0.53125 1 TIHTIN ES 90671 OOSTA 201 11 6.10 . 2009 84 6. 0.00 178 012 . 2 * Interpret the slope: For every unit increase in study hours, gpa increases/decreases by What percent of variation in gpa is explained by varying study hours? The correlation between study hours and gpa is _indicating a weak/strong and negative/positive relationship Forecast gpa based on studying 5 hours per week. . Answer 1 of 1 Done A,B) 733 AVERAGE YEAR SEMESTER GA PAHA FRESHMAN FALL 25 FRESHMAN SPRING 22 2.5 FRESHMAN SUMMER 27 2 SOPHOMORA 2.08 SOPOMORE SPRING 25 26 2.7048 SOPHOMORE SUMMER 12.55 2.288 JUNIOR FALL 12 2.325 27738 JUNIOR SPRING 2:55 25 JUNIOR SUMMER 33 2005 2.4558823 2.95 10331092 WE HAVE FOUNT MAIS 30 WE HAVE FOR AURA 4.30 2 11 12 11 14 15 16 17 Sum of X = 45 Sum of Y = 25.2 Mean X = 5 Mean Y = 2.8 Sum of squares (55x) = 60 Sum of products (SP) = 5.7 Regression Equation = y =bX+a b = SP/SSx = 5.7/60 = 0.095 a = My - My = 2.8 -0.15) = 2.325 c) 9 = 0.095X + 2.325 FOR SENIOR FALL WE HAVE X=10 Y=0.95+2.325= 3.275 FOR X=11 WE HAVE Y=0.095*11+2.325= 3.37 IV) SONOVO OOON AMOROU Step by Step Solution
There are 3 Steps involved in it
1 Expert Approved Answer
Step: 1 Unlock

Question Has Been Solved by an Expert!
Get step-by-step solutions from verified subject matter experts
Step: 2 Unlock
Step: 3 Unlock