

Question: The answer is not E In checking conditions for constructing confidence intervals for a population mean, it's important to plot the distribution of sample data.
The answer is not E
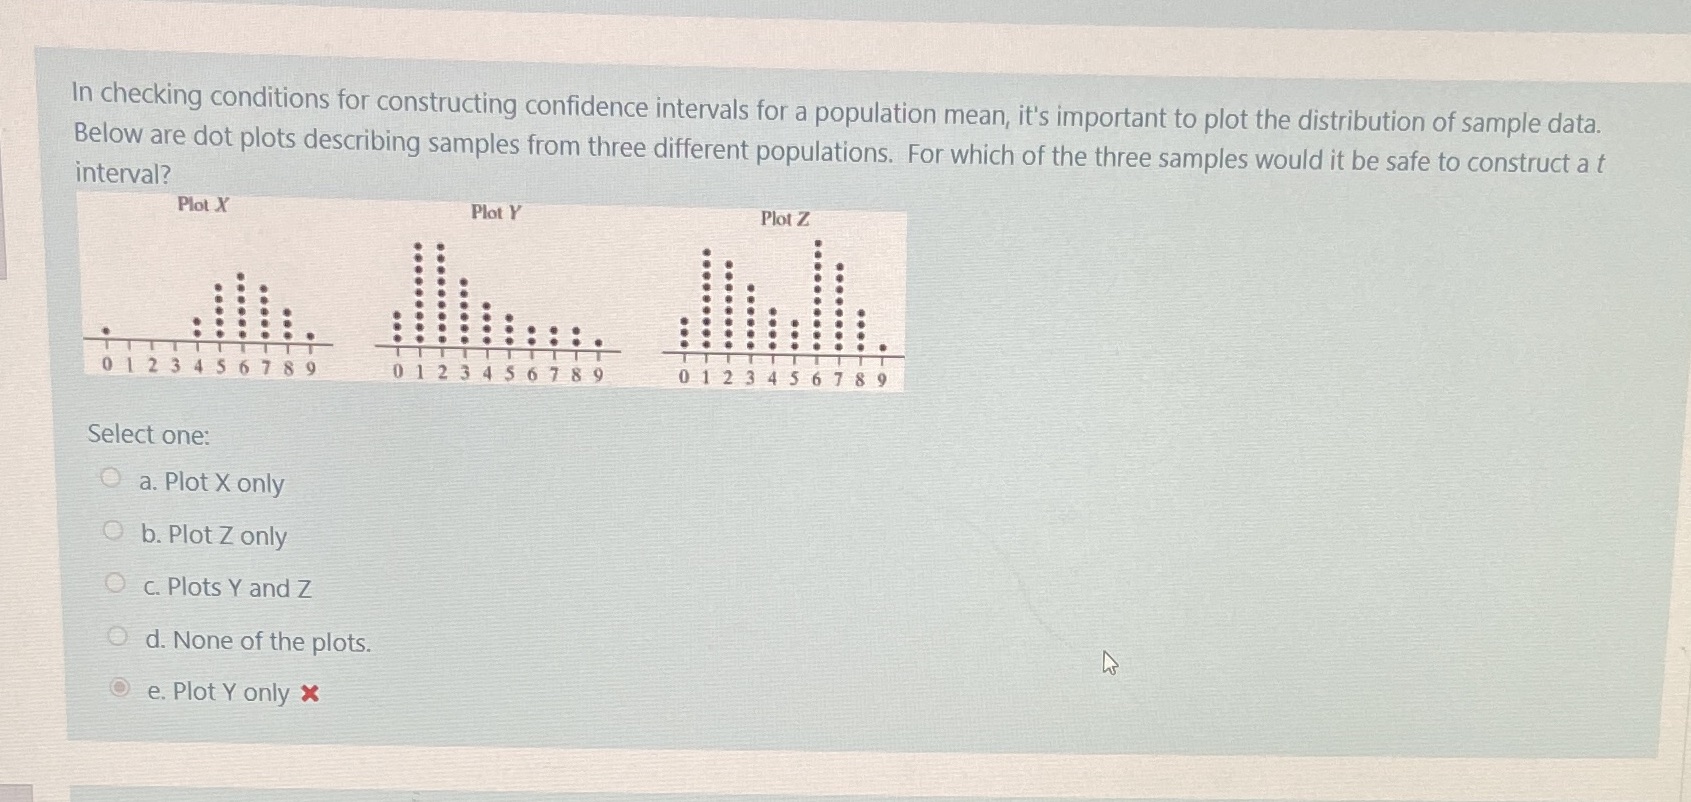
In checking conditions for constructing confidence intervals for a population mean, it's important to plot the distribution of sample data. Below are dot plots describing samples from three different populations. For which of the three samples would it be safe to construct a t interval? Plot X Plot Y Plot Z ...... 2 : 34567 89 0123456789 0 1 4 56789 Select one: O a. Plot X only O b. Plot Z only O c. Plots Y and Z O d. None of the plots. e. Plot Y only x
Step by Step Solution
There are 3 Steps involved in it
1 Expert Approved Answer
Step: 1 Unlock

Question Has Been Solved by an Expert!
Get step-by-step solutions from verified subject matter experts
Step: 2 Unlock
Step: 3 Unlock