

Question: The answer needs to be in Excel. Need to know step by step on how to do this problem. The variables control chart is monitoring
The answer needs to be in Excel. Need to know step by step on how to do this problem.
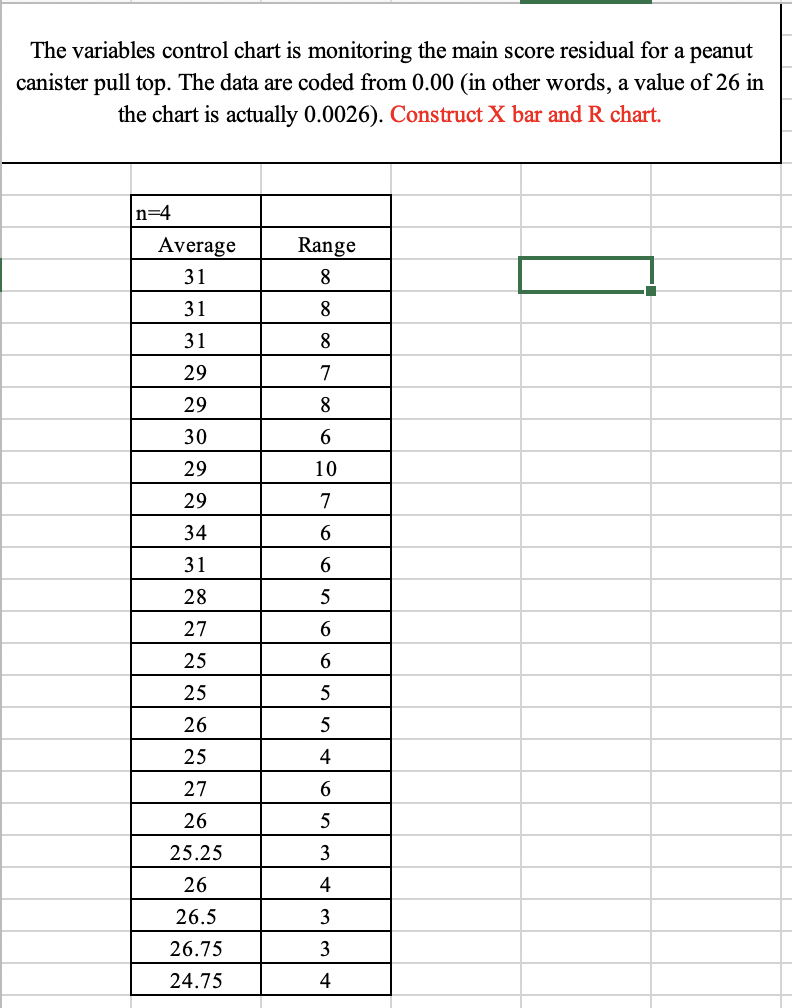
The variables control chart is monitoring the main score residual for a peanut canister pull top. The data are coded from 0.00 (in other words, a value of 26 in the chart is actually 0.0026). Construct X bar and R chart. n=4 Range Average 31 8 8 31 31 8 29 7 29 8 30 6 10 29 29 34 7 6 6 5 31 28 27 25 25 6 6 5 26 5 4 6 25 27 26 25.25 26 26.5 5 3 4 3 3 26.75 24.75 4Step by Step Solution
There are 3 Steps involved in it
1 Expert Approved Answer
Step: 1 Unlock

Question Has Been Solved by an Expert!
Get step-by-step solutions from verified subject matter experts
Step: 2 Unlock
Step: 3 Unlock