

Question: The Answer Schedule shows the points per question / answer Points available for each answer are all or nothing - must be correct answer AND
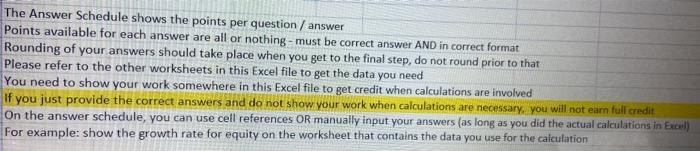
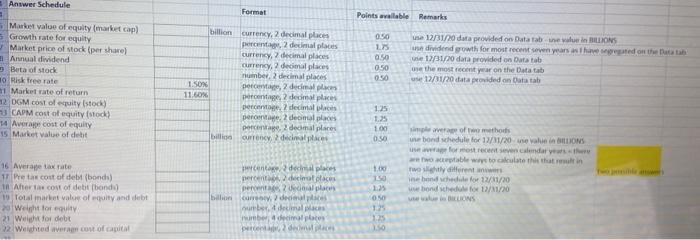
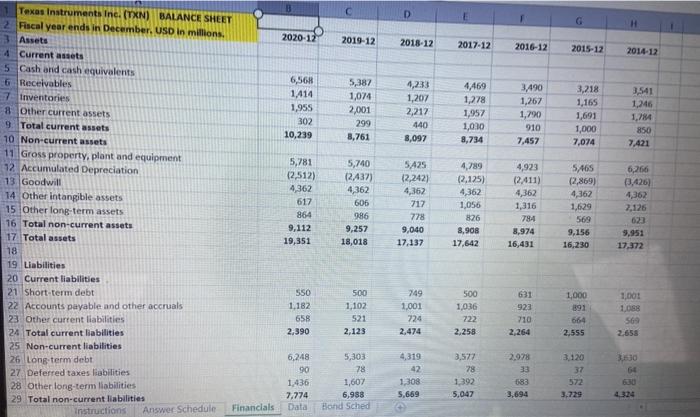
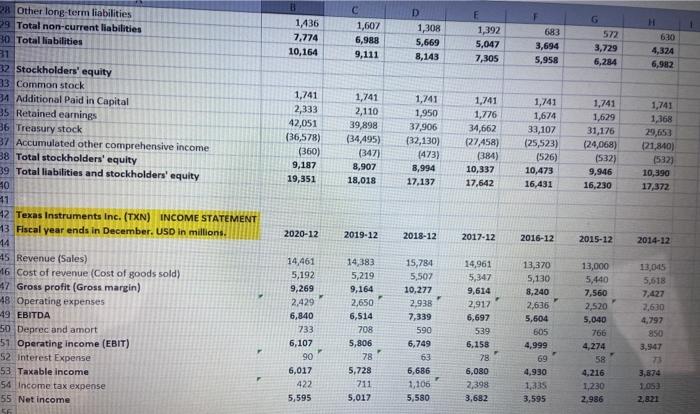
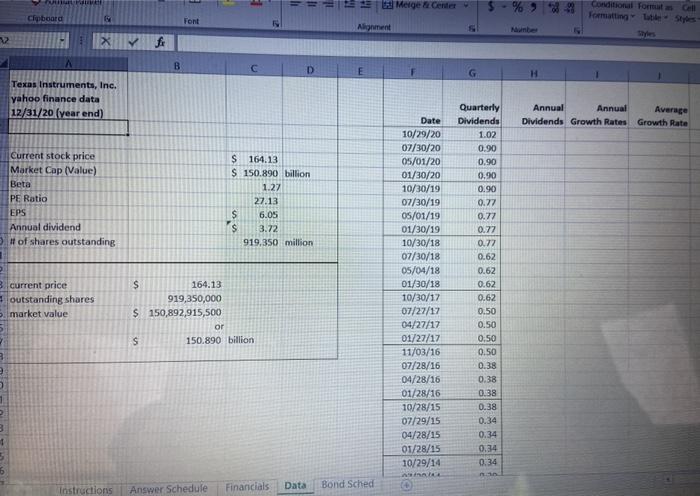
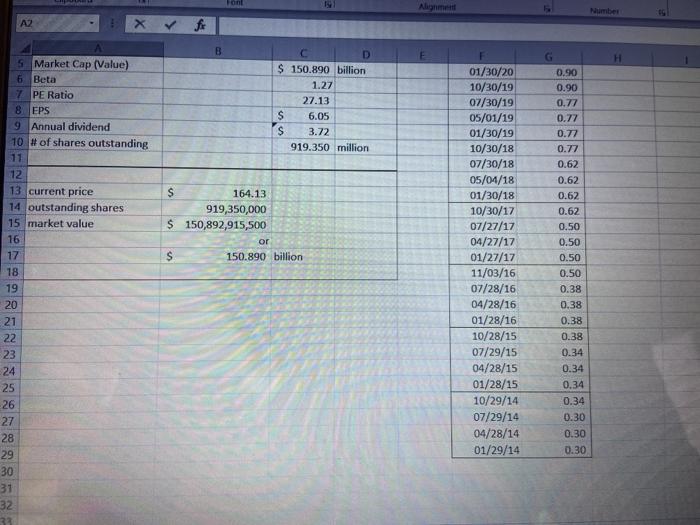
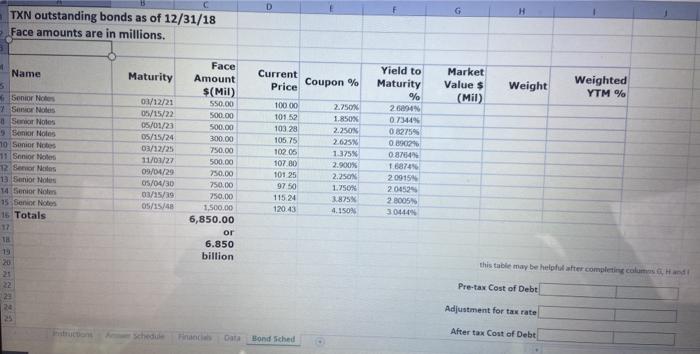
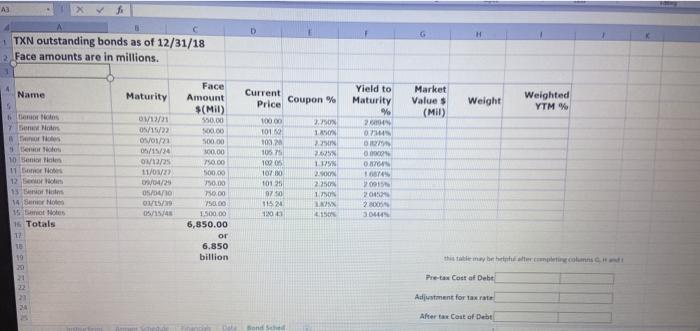
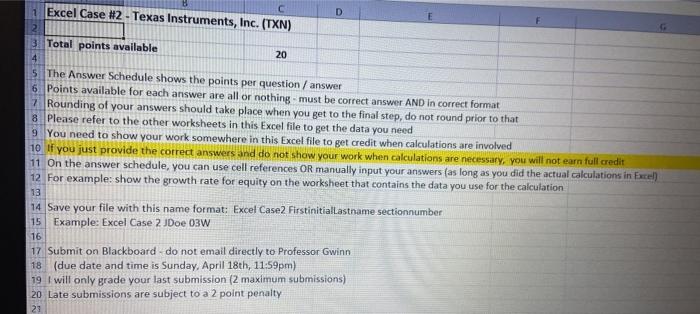
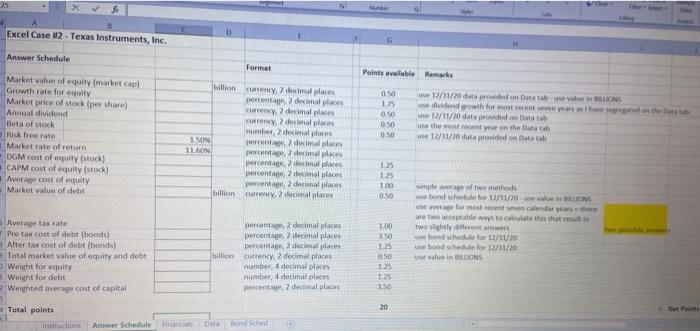
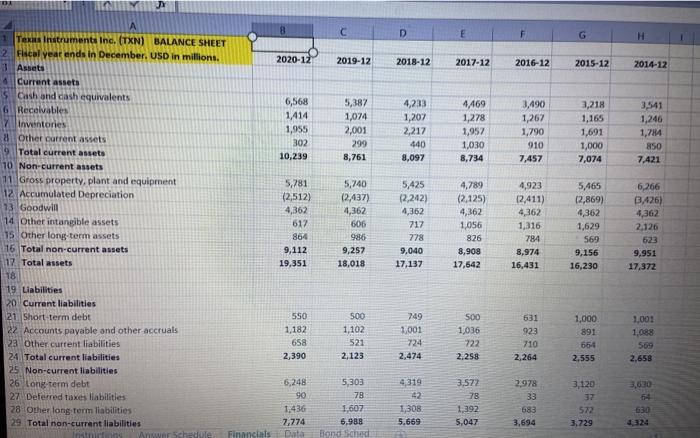
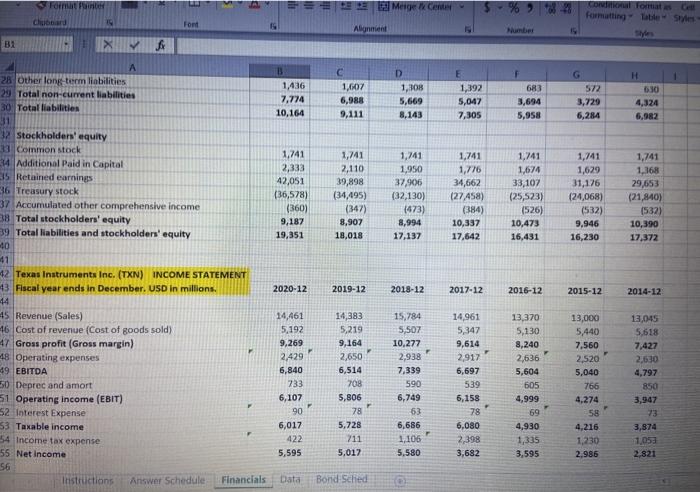
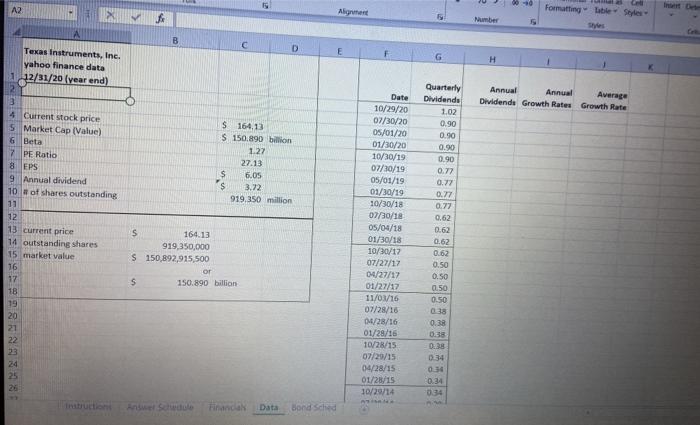
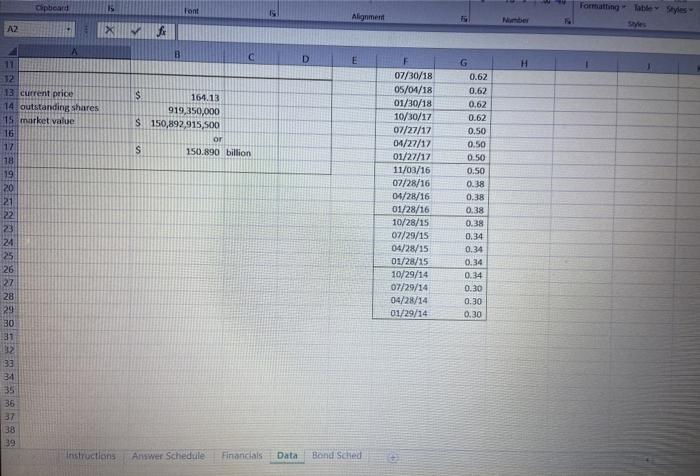
The Answer Schedule shows the points per question / answer Points available for each answer are all or nothing - must be correct answer AND in correct format Rounding of your answers should take place when you get to the final step, do not round prior to that Please refer to the other worksheets in this Excel file to get the data you need You need to show your work somewhere in this Excel file to get credit when calculations are involved If you just provide the correct answers and do not show your work when calculations are necessary, you will not earn full credit On the answer schedule, you can use cell references OR manually input your answers (as long as you did the actual calculations in Excel) For example: show the growth rate for equity on the worksheet that contains the data you use for the calculation Answer Schedule Format Points available Remarks Market value of equity market cap Growth rate for equity Market price of stock (per share Annual dividend Beta of stock 10 Risk free rate 1 Market rate of return 2 GM cost of equity (stock) CAPM cost of equitystod 14 Average cost of equity 15 Market value of det 0.50 25 aso 0.50 050 billion currency. 2 decimal places percentag2 decimal places currency decimal places Currency 2 decimal places number, 2 decimal places 1. SON per 2 decimal 11:60% percentage 2 decimal percent decimal places percentage 2 decimal places percentage decimal places billis Orc decimales 12/31/20 data provided on Data tabe we in LIONS dividend growth for most recent seven years as heated on the tota 17/31/20 data provided on Duta tab use the most recent year on the Datatab 12/11/20 data provided on Datatab 135 1.35 100 0.50 1.00 Per cento de percento de molace per plans average of thos bond schedule for 12/11/20 sevahiNS Borrostreet stundar e ble ways to calculate this that in westly different in bed whedule for 13/01/20 we bond the 13/11/20 wwwi LIONS 16 Average tax rate 11 Peta cout of de bonds) Aherte cost of debit bond 19Total market value of multy and debt 20 Weight for et 21 Weight for det 12 Wehted cost of capital bilioni OS 1 sumber decimal places pere 1.50 D G H 2020-12 2019-12 2018-12 2017-12 2016-12 2015-12 2014-12 6,568 1414 1,955 302 10,239 5,387 1,074 2,001 299 8,761 4,233 1,207 2,217 440 8,097 4,469 1,278 1,957 1,080 8,734 3,490 1,267 1,790 910 7,457 3,218 1,165 1,691 1,000 7,074 3,541 1,246 1,784 850 7,421 Texas Instruments Inc. (TXN) BALANCE SHEET 2 Fiscal year ends in December, USD in millions 3 Assets 4 Current assets 5 Cash and cash equivalents 6 Receivables 7 Inventories 8 Other current assets 9 Total current assets 10 Non-current assets 11 Gross property, plant and equipment 12 Accumulated Depreciation 13 Goodwill 14 Other intangible assets 15 Other long-term assets 16 Total non-current assets 17 Total assets 18 19 Liabilities 20 Current liabilities 21 Short-term debt 22 Accounts payable and other accruals 23 Other current liabilities 24 Total current liabilities 25 Non-current liabilities 26 Long-term debt 27 Deferred taxes liabilities 28 Other long-term liabilities 29 Total non-current liabilities Instructions 5,781 12,512) 4,362 617 864 9,112 19,351 5,740 2,437) 4,362 606 986 9,257 18,018 5425 12,242) 4,362 717 778 9,040 17.137 4,789 (2.125) 4,362 1,056 826 8,908 17,642 4,923 (2.411) 4,362 1,316 784 8,974 16,431 5465 (2,869) 4,362 1,629 569 9.156 16,230 6,266 (426) 4,362 2,126 17,372 631 500 1,102 S50 1,182 658 2,390 749 1,001 724 2,474 500 1,036 222 2,258 1,001 1,088 521 923 710 2,264 1,000 891 664 2,555 2,123 2.658 3.577 3,630 64 6,248 90 1.436 7,774 5,303 78 1,607 6,988 Bond Sched 4,319 42 1,308 5,669 78 1392 5,047 2.978 33 683 3,694 37 572 3,729 4,324 Answer Schedule Financials Data = 11 1 Merge Center *** Cipboard fy Font Conditional Forest Call Formatting to se Styles Algement X fi A B D E H Texas Instruments, Inc. yahoo finance data 12/31/20 (year end) Annual Annual Dividends Growth Rates Average Growth Rate Current stock price Market Cap (Value) Beta PE Ratio EPS Annual dividend # of shares outstanding $164.13 $ 150.890 billion 1.27 27.13 s 6.05 $ 3.72 919.350 million current price outstanding shares 5. market value $ 164.13 919,350,000 $ 150,892,915,500 or S 150.890 billion Date 10/29/20 07/30/20 05/01/20 01/30/20 10/30/19 07/30/19 05/01/19 01/30/19 10/30/18 07/30/18 05/04/18 01/30/18 10/30/17 07/27/17 04/27/17 01/27/17 11/03/16 07/28/16 04/28/16 01/28/16 10/28/15 07/29/15 04/28/15 01/28/15 10/29/14 Quarterly Dividends 1.02 0.90 0.90 0.90 0.90 0.77 0.77 0.77 0.77 0.62 0.62 0.62 0.62 0.50 0.50 0.50 0.50 0.38 0.38 0.38 0.38 0.34 0.34 0.34 0.34 3 1 3 1 nu Data Instructions Financials Bond Sched Answer Schedule Fon Alignment Number AZ B $ 150.890 billion 1.27 27.13 $ 6.05 s 3.72 919.350 million $ 164.13 919,350,000 $ 150,892,915,500 or 150.890 billion S S Market Cap (Value) 6 Beta 7 PE Ratio 8 EPS 9 Annual dividend 10 # of shares outstanding 11 12 13 current price 14 outstanding shares 15 market value 16 17 18 19 20 21 22 23 24 25 26 27 28 29 30 31 32 33 01/30/20 10/30/19 07/30/19 05/01/19 01/30/19 10/30/18 07/30/18 05/04/18 01/30/18 10/30/17 07/27/17 04/27/17 01/27/17 11/03/16 07/28/16 04/28/16 01/28/16 10/28/15 07/29/15 04/28/15 01/28/15 10/29/14 07/29/14 04/28/14 01/29/14 G 0.90 0.90 0.77 0.77 0.77 0.77 0.62 0.62 0.62 0.62 0.50 0.50 0.50 0.50 0.38 0.38 0.38 0.38 0.34 0.34 0.34 0.34 0.30 0.30 0.30 G H TXN outstanding bonds as of 12/31/18 Face amounts are in millions. Name Maturity Current Price Coupon % Market Value $ (Mil) Weight Weighted YTM % Senior Not 7. Senior Notes Sencor Notes Benior Notes 10 Senior Notes 11 Senior Notes Sennor Notes 13 Senior Notes 14 Senior Nom 15 Sonice Noten 15 Totals 17 02/12/21 05/15/22 05/01/23 05/15/24 03/12/25 11/03/27 05/04/29 05/04/30 03/15/19 05/15/48 Face Amount $(Mil) 550.00 500.00 500.00 300.00 750.00 500.00 750.00 750.00 750,00 1,500.00 6,850.00 or 6.850 billion 10000 101.52 103.28 105.75 102.06 107 BD 101 25 97 50 115.24 120.43 2.750% 1.850X 2.250 2.625 1.375 2.900% 2.250 1.750% 3.85% 4.150 Yield to Maturity % 2 6094 0.7344% 0.82759 01202 0814 18874 209154 204529 2 8005 304449 TR 20 this table may be helpful ter completing comes and PRENA Pre-tax Cost of Debt Adjustment for tax rate After tax Cost of Debt Bond sched A3 TXN outstanding bonds as of 12/31/18 2 Face amounts are in millions. Name Maturity Current Price Coupon % Market Values (MID) Weight Weighted YTM % Face Amount $(Mil) 550.00 0.00 500.00 100,00 Yield to Maturity % 2. 0 BIN tors 7 No os ter Teos 10 ani 11 Bolo 12 L 15 Boris 14 Samar No motos 16 Totals TH 011/ 05/15/22 O/01/2 05/15724 Os 11/01 04/23 05/04/10 01/05/ 05/14 07 500.00 10000 101 10320 105 10005 107 BO 1015 070 11524 1200 3.50 1 2. 2. 1.17 20 2250 INSON LINN 4150 2015 20 2.000 3D 190.00 750.00 750.00 1.500.00 6,850.00 or 6.850 billion 19 this may be coming Pre-tax cost of Debt Adjustment for tax rate After tax Cost of Debt Sate Bond sched D Excel Case #2 - Texas Instruments, Inc. (TXN) 2 3 Total points available 20 4 5 The Answer Schedule shows the points per question/answer 6. Points available for each answer are all or nothing - must be correct answer AND in correct format 7 Rounding of your answers should take place when you get to the final step, do not found prior to that 8 Please refer to the other worksheets in this Excel file to get the data you need 9 You need to show your work somewhere in this Excel file to get credit when calculations are involved 10 if you just provide the correct answers and do not show your work when calculations are necessary, you will not earn full credit 11 On the answer schedule, you can use cell references OR manually input your answers (as long as you did the actual calculations in Excel) 12 For example: show the growth rate for equity on the worksheet that contains the data you use for the calculation 13 14 Save your file with this name format: Excel Case2 Firstinitiallastname sectionnumber 15 Example: Excel Case 2 JDoe 03W 16 17 Submit on Blackboard - do not email directly to Professor Gwinn 18 (due date and time is Sunday, April 18th, 11:59pm) 19 I will only grade your last submission (2 maximum submissions) 20 Late submissions are subject to a 2 point penalty 23 Excel Case #2 - Texas Instruments, Inc. Answer Schedule Format Points weble Remarks 0 1. Market value of equitymarket cap) Growth rate for equity Market price of stock (per share Annual dividend Bet of stock Risk free rate Market rate of return DGM cost of equity (stock) CAPM cost of equity (stock) Average cost of equity Market value of debt 050 050 054 willion currency, 2 decimal places percentar 2 decimal places currency 2 decimal places cu 2 decimal places number, 2 decimal places 1 SON per decisions 11.50% percent decimal place percent. 2 decimal places percent omal places percentas 2 decimal plans billion, 2 decimal places 11/11/20 data provided on Database value in ONS se vidend will for more have gated on the Data 12/11/20 datovided on Datab w the more won the Batata 1/11/20 fot provided on Duta tah 1.25 1.25 1.00 0.50 Average tax rate Pre tax cost of debt bonds) After tax cost of debt (bonds) Total market value of equity and debt Weight for equity 1 Weight for debt Weighted average cost of capital percent, 2 decimal places percenta decimal places percentage 2 decimal places billion cutrenky, 2 decimal places number 6 decimal places number 4 decimal places percentage decimal plan 100 250 125 050 15 1.25 we w of two methods we band had for 11/11/ 20LONS us for most recent calendar years there are table ways to call the in two why dit answer webend schedule for 19/11/20 bond schedule for 13/11/20 value in BIONS 20 Total points irructions Answer Schedule financials and 8 D G H 2020-12 2019-12 2018-12 2017-12 2016-12 2015-12 2014-12 6,568 1414 1,955 302 10,239 5,387 1,074 2,001 299 8,761 4,233 1,207 2,217 440 8,097 4469 1,278 1,957 1,030 8,734 3,490 1,267 1,790 910 7,457 3,218 1,165 1,691 1,000 7,074 3,541 1,246 1,784 850 7,421 Texas Instruments Inc. (TXN) BALANCE SHEET 2. Flical year ends in December. USD in millions. 3 Assets Current assets S Cash and cash equivalents 6 Receivables tnwstories 8 Other current assets 9 Total current assets 10 Non-current assets 11. Gross property, plant and equipment 12 Accumulated Depreciation 33 Goodwill 14 Other intangible assets 15 Other long-term assets 16 Total non-current assets 17 Total assets 18 19 Liabilities 20 Current liabilities 21 Short-term debt 22 Accounts payable and other accruals 23 Other current liabilities 24. Total current liabilities 25 Non-current liabilities 26 long term debt 27 Deferred taxes liabilities 28 other long term liabilities 29 Total non-current liabilities Inc Answer Schedule 5,781 (2,512) 4,362 612 864 9,112 19,351 5,740 (2.437) 4,362 606 986 9,257 18.018 5,425 (2,242) 4,362 717 778 9,040 17,137 4,789 (2,125) 4,362 1,056 826 8,908 17,642 4,923 12,411) 4,362 1,316 784 8,974 16,431 5,465 (2,869) 4,362 1,629 569 9,156 16,230 6,266 3,426 4,362 2,126 623 9.951 17,372 550 1,182 500 1,102 521 2,123 749 1.001 724 2,474 500 1,036 722 2.258 658 631 923 710 2,264 1,000 891 654 2,555 1,001 1,088 500 2,658 2,390 3.572 6,248 90 1.436 7,774 Data 5,303 78 1,607 6,988 Bond Schad 4319 42 1,308 5.669 78 1.392 5,047 2.978 33 683 3,694 3,120 37 572 3,729 630 4324 Financials S FOR Merge Center CON fortas Formatting Chubbard 19 Font Alignment B2 X c 1,607 6,988 9,111 D 1,1108 5,669 8.143 E 1,392 5,047 7,305 683 3,694 5,958 G 572 3,729 6,284 H 630 4,324 6,982 1,741 1,168 1,741 2,110 39,898 (34,495) (347) 8,907 18,018 1,741 1,950 37,906 (32,130) (473) 8,994 17,137 1,741 1,776 34,662 (27,458) (384) 10,337 17.642 1,741 1,674 33,107 (25,523) (526) 10,473 16,431 1,741 1,629 31,176 (24,068) (532) 9.946 16,230 (21,840) (532) 10,390 17,372 A B 28 Other long-term liabilities 1,436 29 Total non-current liabilities 7,774 30 Total liabilities 10,164 31 32 Stockholders' equity 33 Common stock 1.741 14 Additional Paid in Capital 2,333 15 Retained earnings 42,051 36 Treasury stock (36,578) 37 Accumulated other comprehensive income (360) 38 Total stockholders' equity 9,187 39 Total liabilities and stockholders' equity 19,351 0 41 12 Texas Instruments Inc. (TXN) INCOME STATEMENT 13 Fiscal year ends in December. USD in millions. 2020-12 44 45 Revenue (Sales) 14,461 16 Cost of revenue (Cost of goods sold) 5,192 47 Gross profit (Gross margin) 9,269 -18 Operating expenses 2,429 49 EBITDA 6,840 50 Deprecand amort 733 51 Operating Income (EBIT) 6,107 52 Interest Expense 90 53 Taxable income 6,017 54 Income tax expense 422 55 Net Income 5,595 56 Instructions Answer Schedule Financials Data 2019-12 2018-12 2017-12 2016-12 2015-12 2014-12 F 14,383 5,219 9,164 2,650 6,514 708 5,806 78 5,728 211 5,017 15,784 5,507 10,277 2,938 7,339 590 6,749 63 6,686 1,105 5,580 14,961 5,347 9,614 2,917 6,697 539 6,158 78 13,370 5,130 8,240 2,636 5,604 605 4,999 69 4,930 1,335 3,595 13,000 5,440 7.560 2.520 5,040 766 4,274 F 58 4,216 1,230 2.986 13,045 5,618 7,427 2,630 4,797 850 3,947 6,080 2,398 3,682 3,874 1,053 2.821 Bond Schied 09-10 A2 Altant Formatting table Sole & Number B D E G Texas Instruments, Inc. yahoo finance data 1 12/31/20 [year end) H Annual Annual Average Dividende Growth Rates Growth Rate $164.13 $ 150.890 billion 1.27 27.13 $ 6.05 $ 3.72 919.350 million 4 Current stock price 5 Market Cap (value) 6 Beta 7 PE Ratio 8 EPS 9 Annual dividend 10 of shares outstanding 11 12 13 current price 14 outstanding shares 15 market value 16 17 1B 19 20 21 22 23 24 25 26 s 164.13 919,350,000 $ 150,892,915,500 or s 150.890 billion Date 10/29/20 07/30/20 05/01/20 01/30/20 10/30/19 07/30/19 05/01/19 01/30/19 10/30/18 07/30/18 05/04/18 01/30/18 10/30/12 07/27/17 04/27/17 01/27/17 11/03/16 07/28/16 01/28/16 01/28/16 10/28/15 07/29/15 04/28/15 01/28/15 10/29/14 Quarterly Dividendo 1.02 0.90 0.90 0.90 0.90 0.77 0.77 0.77 0.77 0.62 0.62 0.62 0.62 0.50 0.50 0.50 0.50 038 0.38 038 0.38 0.34 0.34 0.34 Data Bond Sched pucard Font Formatting table Styles 5 Alignment X 3 D E $ 164.13 919,350,000 S 150,892,915,500 or S 150.890 billion A 11 12 13 current price 14 outstanding shares 15 market value 16 17 18 119 20 21 22 23 24 25 26 27 28 329 30 31 132 33 31 35 36 F 07/30/18 05/04/18 01/30/18 10/30/17 07/27/17 04/27/17 01/27/17 11/03/16 07/28/16 04/28/16 01/28/16 10/28/15 07/29/15 04/28/15 01/28/15 10/29/14 07/29/14 04/28/14 01/29/14 G 0.62 0.62 0.62 0.62 0.50 0.50 0.50 0.50 0.38 0.38 0.38 0.38 0.34 0.34 0.34 0.34 0.30 0.30 0.30 38 39 Instructions Answer Schedule Financials Data Band Sched The Answer Schedule shows the points per question / answer Points available for each answer are all or nothing - must be correct answer AND in correct format Rounding of your answers should take place when you get to the final step, do not round prior to that Please refer to the other worksheets in this Excel file to get the data you need You need to show your work somewhere in this Excel file to get credit when calculations are involved If you just provide the correct answers and do not show your work when calculations are necessary, you will not earn full credit On the answer schedule, you can use cell references OR manually input your answers (as long as you did the actual calculations in Excel) For example: show the growth rate for equity on the worksheet that contains the data you use for the calculation Answer Schedule Format Points available Remarks Market value of equity market cap Growth rate for equity Market price of stock (per share Annual dividend Beta of stock 10 Risk free rate 1 Market rate of return 2 GM cost of equity (stock) CAPM cost of equitystod 14 Average cost of equity 15 Market value of det 0.50 25 aso 0.50 050 billion currency. 2 decimal places percentag2 decimal places currency decimal places Currency 2 decimal places number, 2 decimal places 1. SON per 2 decimal 11:60% percentage 2 decimal percent decimal places percentage 2 decimal places percentage decimal places billis Orc decimales 12/31/20 data provided on Data tabe we in LIONS dividend growth for most recent seven years as heated on the tota 17/31/20 data provided on Duta tab use the most recent year on the Datatab 12/11/20 data provided on Datatab 135 1.35 100 0.50 1.00 Per cento de percento de molace per plans average of thos bond schedule for 12/11/20 sevahiNS Borrostreet stundar e ble ways to calculate this that in westly different in bed whedule for 13/01/20 we bond the 13/11/20 wwwi LIONS 16 Average tax rate 11 Peta cout of de bonds) Aherte cost of debit bond 19Total market value of multy and debt 20 Weight for et 21 Weight for det 12 Wehted cost of capital bilioni OS 1 sumber decimal places pere 1.50 D G H 2020-12 2019-12 2018-12 2017-12 2016-12 2015-12 2014-12 6,568 1414 1,955 302 10,239 5,387 1,074 2,001 299 8,761 4,233 1,207 2,217 440 8,097 4,469 1,278 1,957 1,080 8,734 3,490 1,267 1,790 910 7,457 3,218 1,165 1,691 1,000 7,074 3,541 1,246 1,784 850 7,421 Texas Instruments Inc. (TXN) BALANCE SHEET 2 Fiscal year ends in December, USD in millions 3 Assets 4 Current assets 5 Cash and cash equivalents 6 Receivables 7 Inventories 8 Other current assets 9 Total current assets 10 Non-current assets 11 Gross property, plant and equipment 12 Accumulated Depreciation 13 Goodwill 14 Other intangible assets 15 Other long-term assets 16 Total non-current assets 17 Total assets 18 19 Liabilities 20 Current liabilities 21 Short-term debt 22 Accounts payable and other accruals 23 Other current liabilities 24 Total current liabilities 25 Non-current liabilities 26 Long-term debt 27 Deferred taxes liabilities 28 Other long-term liabilities 29 Total non-current liabilities Instructions 5,781 12,512) 4,362 617 864 9,112 19,351 5,740 2,437) 4,362 606 986 9,257 18,018 5425 12,242) 4,362 717 778 9,040 17.137 4,789 (2.125) 4,362 1,056 826 8,908 17,642 4,923 (2.411) 4,362 1,316 784 8,974 16,431 5465 (2,869) 4,362 1,629 569 9.156 16,230 6,266 (426) 4,362 2,126 17,372 631 500 1,102 S50 1,182 658 2,390 749 1,001 724 2,474 500 1,036 222 2,258 1,001 1,088 521 923 710 2,264 1,000 891 664 2,555 2,123 2.658 3.577 3,630 64 6,248 90 1.436 7,774 5,303 78 1,607 6,988 Bond Sched 4,319 42 1,308 5,669 78 1392 5,047 2.978 33 683 3,694 37 572 3,729 4,324 Answer Schedule Financials Data = 11 1 Merge Center *** Cipboard fy Font Conditional Forest Call Formatting to se Styles Algement X fi A B D E H Texas Instruments, Inc. yahoo finance data 12/31/20 (year end) Annual Annual Dividends Growth Rates Average Growth Rate Current stock price Market Cap (Value) Beta PE Ratio EPS Annual dividend # of shares outstanding $164.13 $ 150.890 billion 1.27 27.13 s 6.05 $ 3.72 919.350 million current price outstanding shares 5. market value $ 164.13 919,350,000 $ 150,892,915,500 or S 150.890 billion Date 10/29/20 07/30/20 05/01/20 01/30/20 10/30/19 07/30/19 05/01/19 01/30/19 10/30/18 07/30/18 05/04/18 01/30/18 10/30/17 07/27/17 04/27/17 01/27/17 11/03/16 07/28/16 04/28/16 01/28/16 10/28/15 07/29/15 04/28/15 01/28/15 10/29/14 Quarterly Dividends 1.02 0.90 0.90 0.90 0.90 0.77 0.77 0.77 0.77 0.62 0.62 0.62 0.62 0.50 0.50 0.50 0.50 0.38 0.38 0.38 0.38 0.34 0.34 0.34 0.34 3 1 3 1 nu Data Instructions Financials Bond Sched Answer Schedule Fon Alignment Number AZ B $ 150.890 billion 1.27 27.13 $ 6.05 s 3.72 919.350 million $ 164.13 919,350,000 $ 150,892,915,500 or 150.890 billion S S Market Cap (Value) 6 Beta 7 PE Ratio 8 EPS 9 Annual dividend 10 # of shares outstanding 11 12 13 current price 14 outstanding shares 15 market value 16 17 18 19 20 21 22 23 24 25 26 27 28 29 30 31 32 33 01/30/20 10/30/19 07/30/19 05/01/19 01/30/19 10/30/18 07/30/18 05/04/18 01/30/18 10/30/17 07/27/17 04/27/17 01/27/17 11/03/16 07/28/16 04/28/16 01/28/16 10/28/15 07/29/15 04/28/15 01/28/15 10/29/14 07/29/14 04/28/14 01/29/14 G 0.90 0.90 0.77 0.77 0.77 0.77 0.62 0.62 0.62 0.62 0.50 0.50 0.50 0.50 0.38 0.38 0.38 0.38 0.34 0.34 0.34 0.34 0.30 0.30 0.30 G H TXN outstanding bonds as of 12/31/18 Face amounts are in millions. Name Maturity Current Price Coupon % Market Value $ (Mil) Weight Weighted YTM % Senior Not 7. Senior Notes Sencor Notes Benior Notes 10 Senior Notes 11 Senior Notes Sennor Notes 13 Senior Notes 14 Senior Nom 15 Sonice Noten 15 Totals 17 02/12/21 05/15/22 05/01/23 05/15/24 03/12/25 11/03/27 05/04/29 05/04/30 03/15/19 05/15/48 Face Amount $(Mil) 550.00 500.00 500.00 300.00 750.00 500.00 750.00 750.00 750,00 1,500.00 6,850.00 or 6.850 billion 10000 101.52 103.28 105.75 102.06 107 BD 101 25 97 50 115.24 120.43 2.750% 1.850X 2.250 2.625 1.375 2.900% 2.250 1.750% 3.85% 4.150 Yield to Maturity % 2 6094 0.7344% 0.82759 01202 0814 18874 209154 204529 2 8005 304449 TR 20 this table may be helpful ter completing comes and PRENA Pre-tax Cost of Debt Adjustment for tax rate After tax Cost of Debt Bond sched A3 TXN outstanding bonds as of 12/31/18 2 Face amounts are in millions. Name Maturity Current Price Coupon % Market Values (MID) Weight Weighted YTM % Face Amount $(Mil) 550.00 0.00 500.00 100,00 Yield to Maturity % 2. 0 BIN tors 7 No os ter Teos 10 ani 11 Bolo 12 L 15 Boris 14 Samar No motos 16 Totals TH 011/ 05/15/22 O/01/2 05/15724 Os 11/01 04/23 05/04/10 01/05/ 05/14 07 500.00 10000 101 10320 105 10005 107 BO 1015 070 11524 1200 3.50 1 2. 2. 1.17 20 2250 INSON LINN 4150 2015 20 2.000 3D 190.00 750.00 750.00 1.500.00 6,850.00 or 6.850 billion 19 this may be coming Pre-tax cost of Debt Adjustment for tax rate After tax Cost of Debt Sate Bond sched D Excel Case #2 - Texas Instruments, Inc. (TXN) 2 3 Total points available 20 4 5 The Answer Schedule shows the points per question/answer 6. Points available for each answer are all or nothing - must be correct answer AND in correct format 7 Rounding of your answers should take place when you get to the final step, do not found prior to that 8 Please refer to the other worksheets in this Excel file to get the data you need 9 You need to show your work somewhere in this Excel file to get credit when calculations are involved 10 if you just provide the correct answers and do not show your work when calculations are necessary, you will not earn full credit 11 On the answer schedule, you can use cell references OR manually input your answers (as long as you did the actual calculations in Excel) 12 For example: show the growth rate for equity on the worksheet that contains the data you use for the calculation 13 14 Save your file with this name format: Excel Case2 Firstinitiallastname sectionnumber 15 Example: Excel Case 2 JDoe 03W 16 17 Submit on Blackboard - do not email directly to Professor Gwinn 18 (due date and time is Sunday, April 18th, 11:59pm) 19 I will only grade your last submission (2 maximum submissions) 20 Late submissions are subject to a 2 point penalty 23 Excel Case #2 - Texas Instruments, Inc. Answer Schedule Format Points weble Remarks 0 1. Market value of equitymarket cap) Growth rate for equity Market price of stock (per share Annual dividend Bet of stock Risk free rate Market rate of return DGM cost of equity (stock) CAPM cost of equity (stock) Average cost of equity Market value of debt 050 050 054 willion currency, 2 decimal places percentar 2 decimal places currency 2 decimal places cu 2 decimal places number, 2 decimal places 1 SON per decisions 11.50% percent decimal place percent. 2 decimal places percent omal places percentas 2 decimal plans billion, 2 decimal places 11/11/20 data provided on Database value in ONS se vidend will for more have gated on the Data 12/11/20 datovided on Datab w the more won the Batata 1/11/20 fot provided on Duta tah 1.25 1.25 1.00 0.50 Average tax rate Pre tax cost of debt bonds) After tax cost of debt (bonds) Total market value of equity and debt Weight for equity 1 Weight for debt Weighted average cost of capital percent, 2 decimal places percenta decimal places percentage 2 decimal places billion cutrenky, 2 decimal places number 6 decimal places number 4 decimal places percentage decimal plan 100 250 125 050 15 1.25 we w of two methods we band had for 11/11/ 20LONS us for most recent calendar years there are table ways to call the in two why dit answer webend schedule for 19/11/20 bond schedule for 13/11/20 value in BIONS 20 Total points irructions Answer Schedule financials and 8 D G H 2020-12 2019-12 2018-12 2017-12 2016-12 2015-12 2014-12 6,568 1414 1,955 302 10,239 5,387 1,074 2,001 299 8,761 4,233 1,207 2,217 440 8,097 4469 1,278 1,957 1,030 8,734 3,490 1,267 1,790 910 7,457 3,218 1,165 1,691 1,000 7,074 3,541 1,246 1,784 850 7,421 Texas Instruments Inc. (TXN) BALANCE SHEET 2. Flical year ends in December. USD in millions. 3 Assets Current assets S Cash and cash equivalents 6 Receivables tnwstories 8 Other current assets 9 Total current assets 10 Non-current assets 11. Gross property, plant and equipment 12 Accumulated Depreciation 33 Goodwill 14 Other intangible assets 15 Other long-term assets 16 Total non-current assets 17 Total assets 18 19 Liabilities 20 Current liabilities 21 Short-term debt 22 Accounts payable and other accruals 23 Other current liabilities 24. Total current liabilities 25 Non-current liabilities 26 long term debt 27 Deferred taxes liabilities 28 other long term liabilities 29 Total non-current liabilities Inc Answer Schedule 5,781 (2,512) 4,362 612 864 9,112 19,351 5,740 (2.437) 4,362 606 986 9,257 18.018 5,425 (2,242) 4,362 717 778 9,040 17,137 4,789 (2,125) 4,362 1,056 826 8,908 17,642 4,923 12,411) 4,362 1,316 784 8,974 16,431 5,465 (2,869) 4,362 1,629 569 9,156 16,230 6,266 3,426 4,362 2,126 623 9.951 17,372 550 1,182 500 1,102 521 2,123 749 1.001 724 2,474 500 1,036 722 2.258 658 631 923 710 2,264 1,000 891 654 2,555 1,001 1,088 500 2,658 2,390 3.572 6,248 90 1.436 7,774 Data 5,303 78 1,607 6,988 Bond Schad 4319 42 1,308 5.669 78 1.392 5,047 2.978 33 683 3,694 3,120 37 572 3,729 630 4324 Financials S FOR Merge Center CON fortas Formatting Chubbard 19 Font Alignment B2 X c 1,607 6,988 9,111 D 1,1108 5,669 8.143 E 1,392 5,047 7,305 683 3,694 5,958 G 572 3,729 6,284 H 630 4,324 6,982 1,741 1,168 1,741 2,110 39,898 (34,495) (347) 8,907 18,018 1,741 1,950 37,906 (32,130) (473) 8,994 17,137 1,741 1,776 34,662 (27,458) (384) 10,337 17.642 1,741 1,674 33,107 (25,523) (526) 10,473 16,431 1,741 1,629 31,176 (24,068) (532) 9.946 16,230 (21,840) (532) 10,390 17,372 A B 28 Other long-term liabilities 1,436 29 Total non-current liabilities 7,774 30 Total liabilities 10,164 31 32 Stockholders' equity 33 Common stock 1.741 14 Additional Paid in Capital 2,333 15 Retained earnings 42,051 36 Treasury stock (36,578) 37 Accumulated other comprehensive income (360) 38 Total stockholders' equity 9,187 39 Total liabilities and stockholders' equity 19,351 0 41 12 Texas Instruments Inc. (TXN) INCOME STATEMENT 13 Fiscal year ends in December. USD in millions. 2020-12 44 45 Revenue (Sales) 14,461 16 Cost of revenue (Cost of goods sold) 5,192 47 Gross profit (Gross margin) 9,269 -18 Operating expenses 2,429 49 EBITDA 6,840 50 Deprecand amort 733 51 Operating Income (EBIT) 6,107 52 Interest Expense 90 53 Taxable income 6,017 54 Income tax expense 422 55 Net Income 5,595 56 Instructions Answer Schedule Financials Data 2019-12 2018-12 2017-12 2016-12 2015-12 2014-12 F 14,383 5,219 9,164 2,650 6,514 708 5,806 78 5,728 211 5,017 15,784 5,507 10,277 2,938 7,339 590 6,749 63 6,686 1,105 5,580 14,961 5,347 9,614 2,917 6,697 539 6,158 78 13,370 5,130 8,240 2,636 5,604 605 4,999 69 4,930 1,335 3,595 13,000 5,440 7.560 2.520 5,040 766 4,274 F 58 4,216 1,230 2.986 13,045 5,618 7,427 2,630 4,797 850 3,947 6,080 2,398 3,682 3,874 1,053 2.821 Bond Schied 09-10 A2 Altant Formatting table Sole & Number B D E G Texas Instruments, Inc. yahoo finance data 1 12/31/20 [year end) H Annual Annual Average Dividende Growth Rates Growth Rate $164.13 $ 150.890 billion 1.27 27.13 $ 6.05 $ 3.72 919.350 million 4 Current stock price 5 Market Cap (value) 6 Beta 7 PE Ratio 8 EPS 9 Annual dividend 10 of shares outstanding 11 12 13 current price 14 outstanding shares 15 market value 16 17 1B 19 20 21 22 23 24 25 26 s 164.13 919,350,000 $ 150,892,915,500 or s 150.890 billion Date 10/29/20 07/30/20 05/01/20 01/30/20 10/30/19 07/30/19 05/01/19 01/30/19 10/30/18 07/30/18 05/04/18 01/30/18 10/30/12 07/27/17 04/27/17 01/27/17 11/03/16 07/28/16 01/28/16 01/28/16 10/28/15 07/29/15 04/28/15 01/28/15 10/29/14 Quarterly Dividendo 1.02 0.90 0.90 0.90 0.90 0.77 0.77 0.77 0.77 0.62 0.62 0.62 0.62 0.50 0.50 0.50 0.50 038 0.38 038 0.38 0.34 0.34 0.34 Data Bond Sched pucard Font Formatting table Styles 5 Alignment X 3 D E $ 164.13 919,350,000 S 150,892,915,500 or S 150.890 billion A 11 12 13 current price 14 outstanding shares 15 market value 16 17 18 119 20 21 22 23 24 25 26 27 28 329 30 31 132 33 31 35 36 F 07/30/18 05/04/18 01/30/18 10/30/17 07/27/17 04/27/17 01/27/17 11/03/16 07/28/16 04/28/16 01/28/16 10/28/15 07/29/15 04/28/15 01/28/15 10/29/14 07/29/14 04/28/14 01/29/14 G 0.62 0.62 0.62 0.62 0.50 0.50 0.50 0.50 0.38 0.38 0.38 0.38 0.34 0.34 0.34 0.34 0.30 0.30 0.30 38 39 Instructions Answer Schedule Financials Data Band Sched
Step by Step Solution
There are 3 Steps involved in it

Get step-by-step solutions from verified subject matter experts