

Question: the answer should be in bear spread. Option Strategies Your task, as the recently recruited PWC's Quant Analyst, is to provide a thorough analysis of
the answer should be in bear spread.
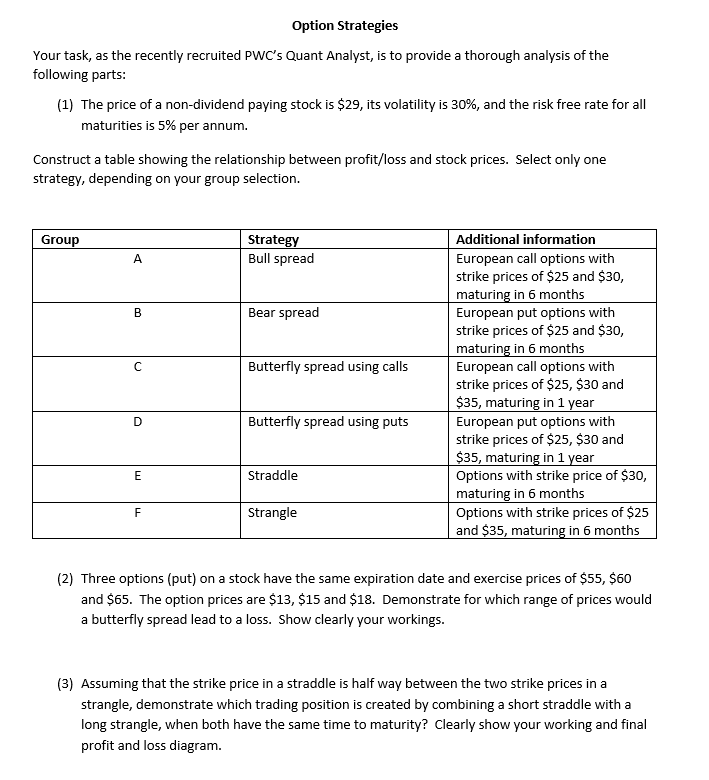
Option Strategies Your task, as the recently recruited PWC's Quant Analyst, is to provide a thorough analysis of the following parts: (1) The price of a non-dividend paying stock is $29, its volatility is 30%, and the risk free rate for all maturities is 5% per annum. Construct a table showing the relationship between profit/loss and stock prices. Select only one strategy, depending on your group selection. Group Strategy Bull spread A B Bear spread Butterfly spread using calls Additional information European call options with strike prices of $25 and $30, maturing in 6 months European put options with strike prices of $25 and $30, maturing in 6 months European call options with strike prices of $25, $30 and $35, maturing in 1 year European put options with strike prices of $25, $30 and $35, maturing in 1 year Options with strike price of $30, maturing in 6 months Options with strike prices of $25 and $35, maturing in 6 months D Butterfly spread using puts E Straddle F Strangle (2) Three options (put) on a stock have the same expiration date and exercise prices of $55, $60 and $65. The option prices are $13, $15 and $18. Demonstrate for which range of prices would a butterfly spread lead to a loss. Show clearly your workings. (3) Assuming that the strike price in a straddle is half way between the two strike prices in a strangle, demonstrate which trading position is created by combining a short straddle with a long strangle, when both have the same time to maturity? Clearly show your working and final profit and loss diagram. Option Strategies Your task, as the recently recruited PWC's Quant Analyst, is to provide a thorough analysis of the following parts: (1) The price of a non-dividend paying stock is $29, its volatility is 30%, and the risk free rate for all maturities is 5% per annum. Construct a table showing the relationship between profit/loss and stock prices. Select only one strategy, depending on your group selection. Group Strategy Bull spread A B Bear spread Butterfly spread using calls Additional information European call options with strike prices of $25 and $30, maturing in 6 months European put options with strike prices of $25 and $30, maturing in 6 months European call options with strike prices of $25, $30 and $35, maturing in 1 year European put options with strike prices of $25, $30 and $35, maturing in 1 year Options with strike price of $30, maturing in 6 months Options with strike prices of $25 and $35, maturing in 6 months D Butterfly spread using puts E Straddle F Strangle (2) Three options (put) on a stock have the same expiration date and exercise prices of $55, $60 and $65. The option prices are $13, $15 and $18. Demonstrate for which range of prices would a butterfly spread lead to a loss. Show clearly your workings. (3) Assuming that the strike price in a straddle is half way between the two strike prices in a strangle, demonstrate which trading position is created by combining a short straddle with a long strangle, when both have the same time to maturity? Clearly show your working and final profit and loss diagram
Step by Step Solution
There are 3 Steps involved in it

Get step-by-step solutions from verified subject matter experts